Tag Archives: Day-2 Operations

Why vSAN is the storage of choice for VMware Cloud Foundation

Recently VMware annouced that Cloud Foundation would support external storage connectivity, when I first heard this I thought to myself are VMware out of their minds? Amongst customers who I meet and talk to more or less on a daily basis, I also spoke to a lot of customers at VMworld about this but the stance or direction from VMware has not changed, if you want a truly Software Defined Data-Center then vSAN is the storage of choice.

So why have VMware decided to allow external storage in Cloud Foundation?

Many customers who are either about to start or have already started their journey to a Software Defined Data Center and/or Hybrid Cloud are still using existing assets that they wish to continue to sweat out, it may well be that their traditional storage is only a couple of years old and VMware are not expecting customers to simply throw out existing infrastructure that was either recently purchased or still being sweat out as that would be a tall ask right?

Customers also still have workloads that can’t simply be migrated to the full SDDC, they take some time to plan the migration, maybe there is a re-architecture of the workload that needs to be performed, or maybe there’s a specific need where a traditional storage array has to be used until any obstacles have been overcome, VMware recognises this hence the support for external storage in Cloud Foundation.

There are also specific use cases where Hyper Converged powered by vSAN isn’t an ideal fit, cold storage or archive storage is one of these, so supporting an array that can provide a suplemental storage architecture to meet these requirements is also a plus point.

Will I lose any functionality by leveraging traditional storage with Cloud Foundation? Simple answer is yes for the following reasons:

  • No lifecycle management for external storage through SDDC Manager which means patching and updating of the storage is still a manual task.
  • No single pane of glass management out of the box for external storage without installing third party plugins which in my experience have a tendancy to break other things.
  • No automation of stretched cluster deployment on external storage, all the replication etc has to be configured manually.
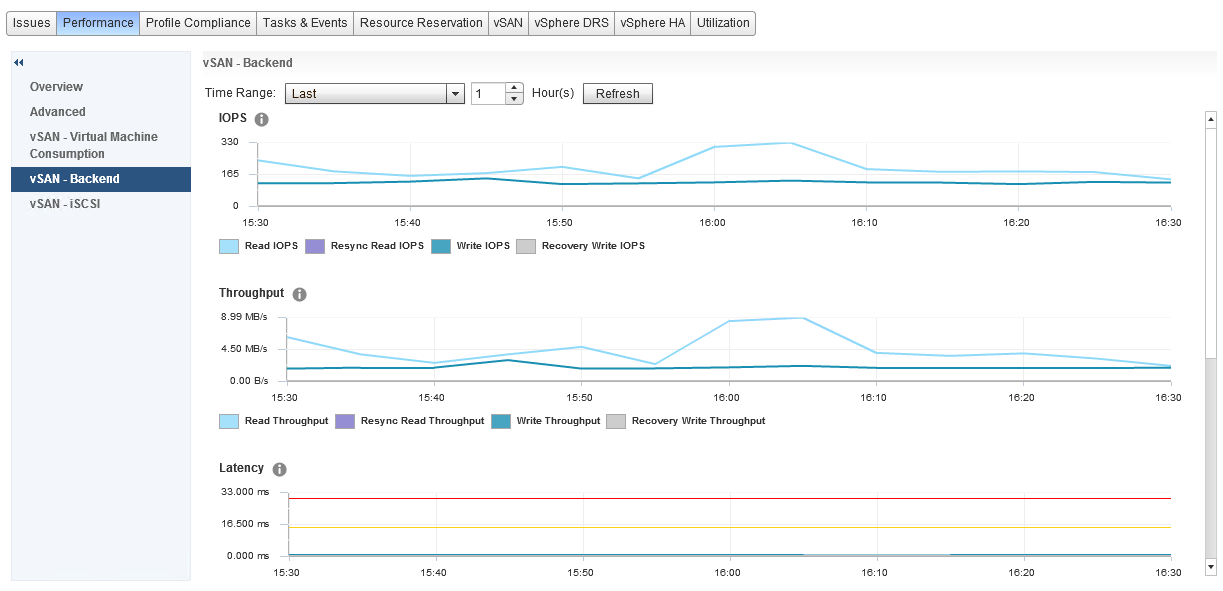
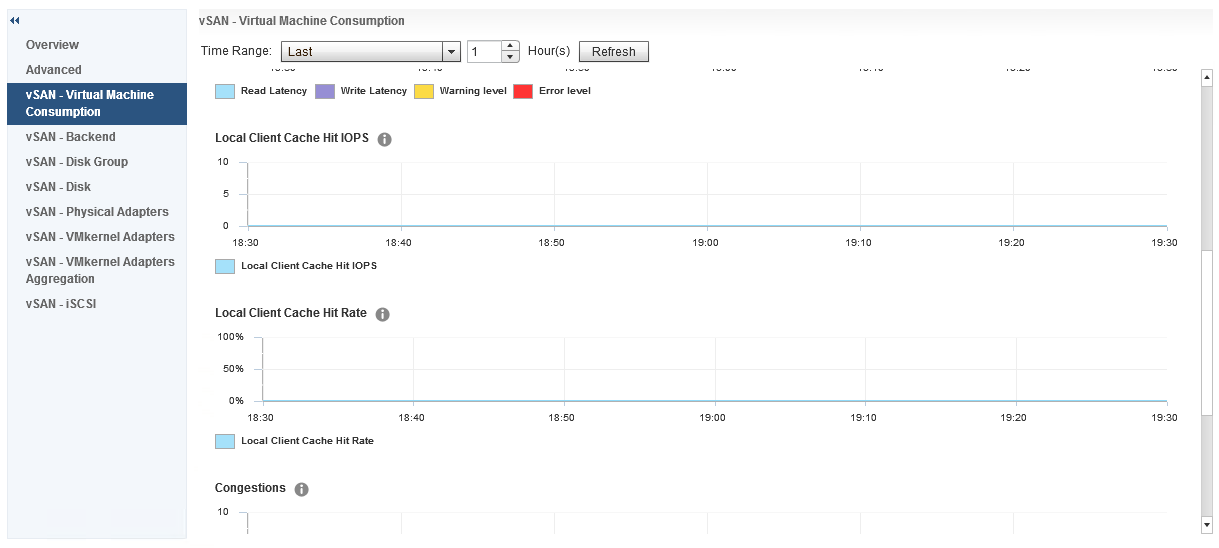
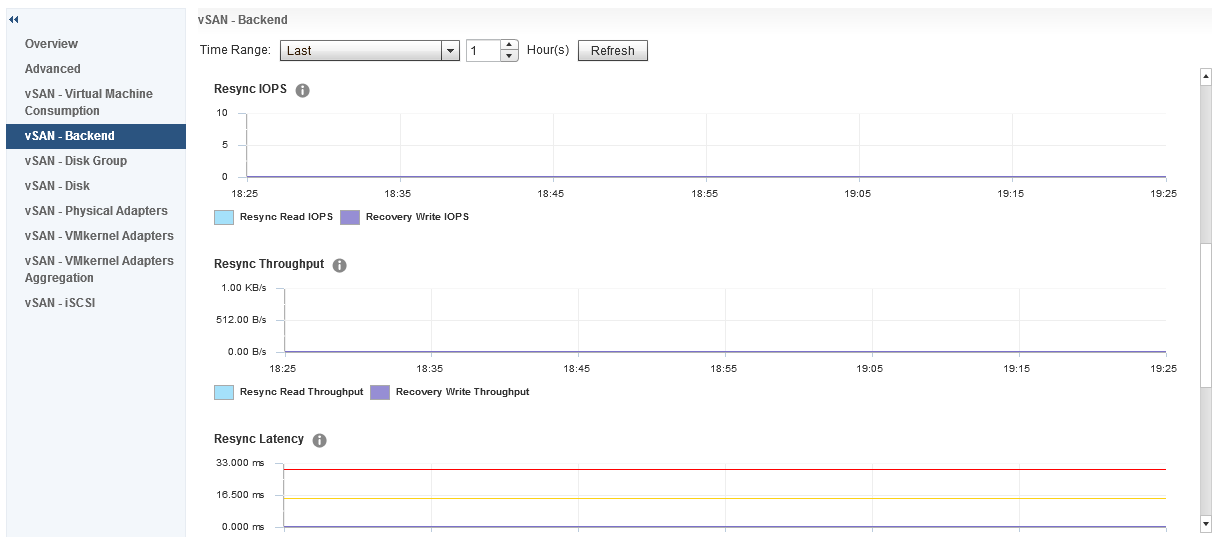
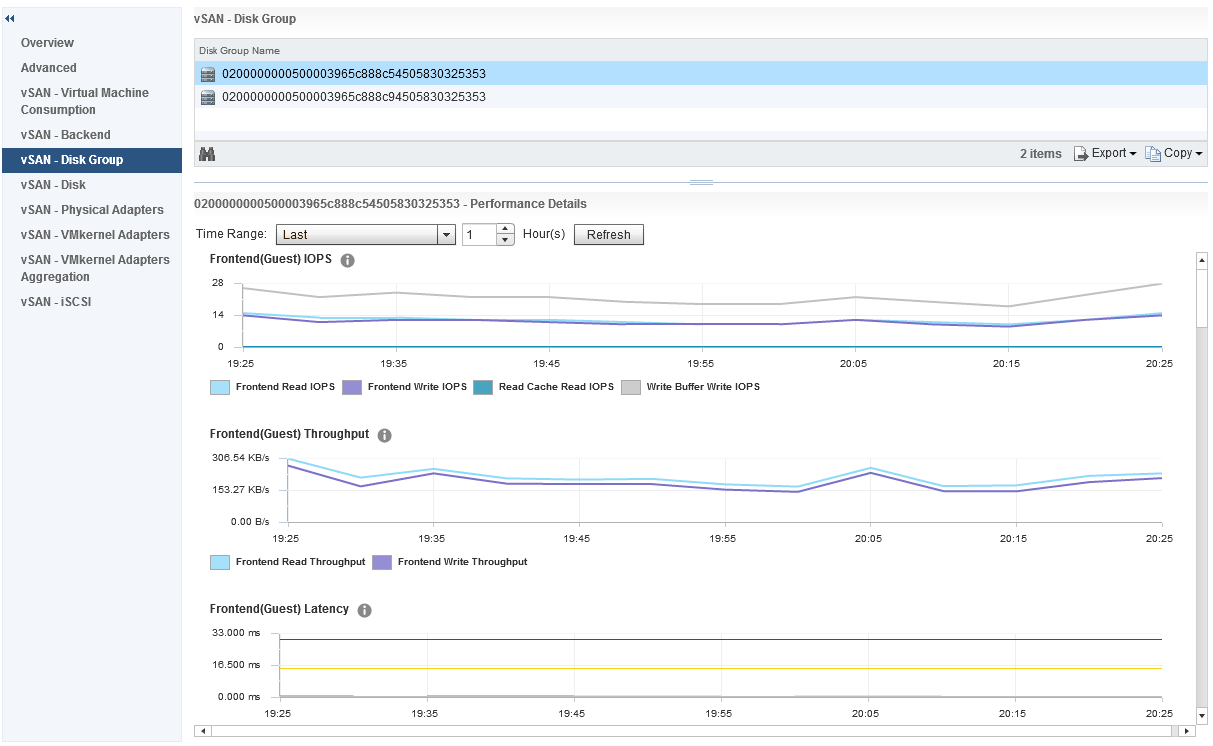
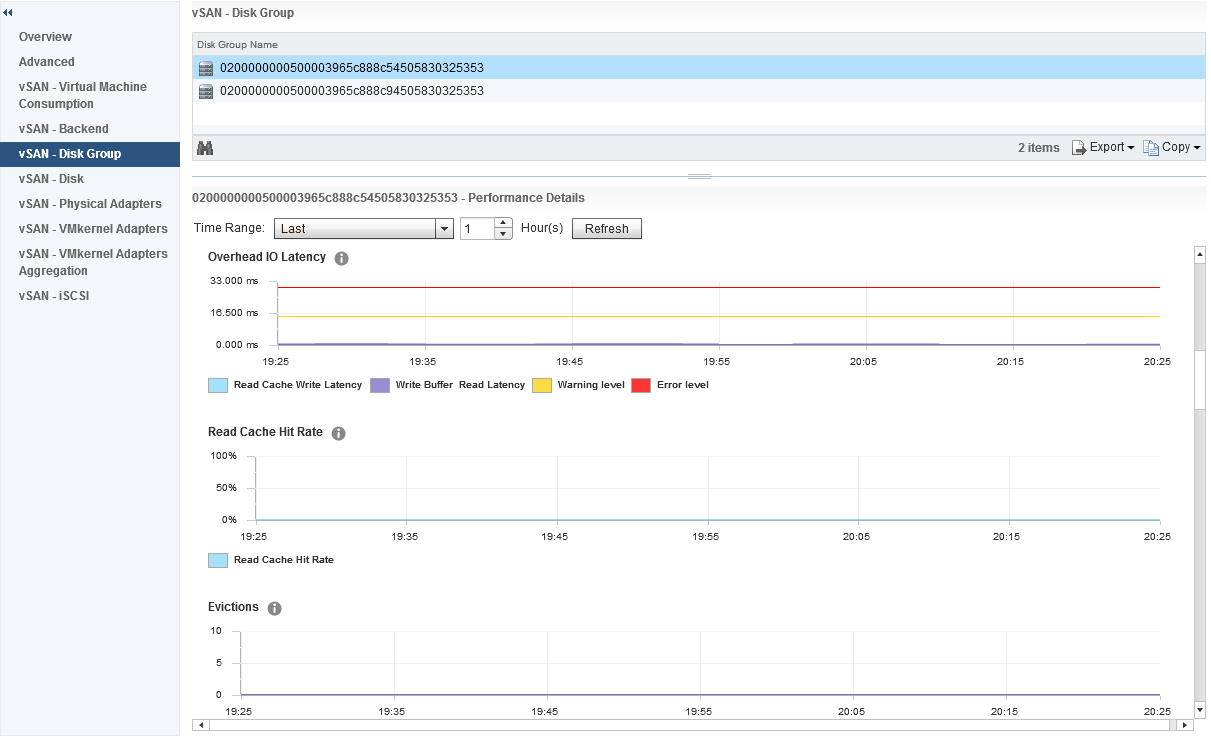
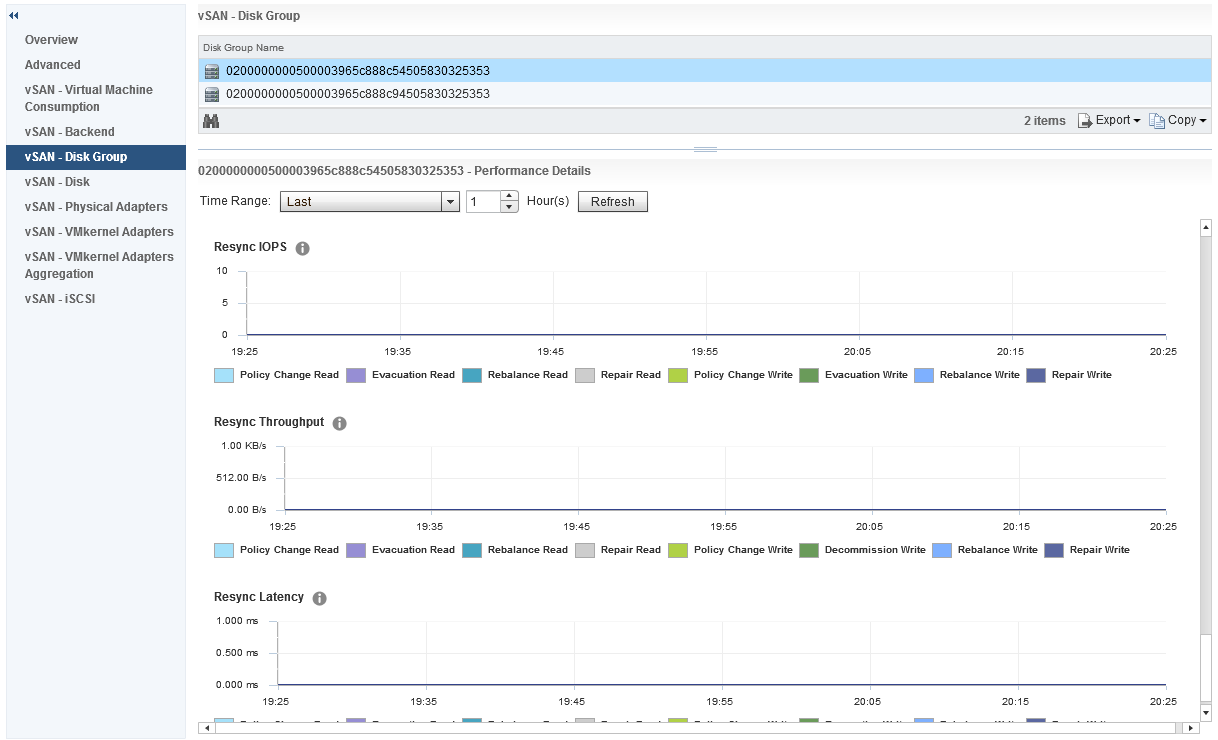
  • Day-2 operations such as Capacity Reporting, Health Check and Performance Monitoring are lost without installing any third party software for the external storage.
  • Auto deployment of the storage during a Workload Domain deployment, all the external storage has to be prepared beforehand.
  • Losing the true “Software Defined Storage” aspect and granular object control, currently external storage support for VVOLS is not there right now either.

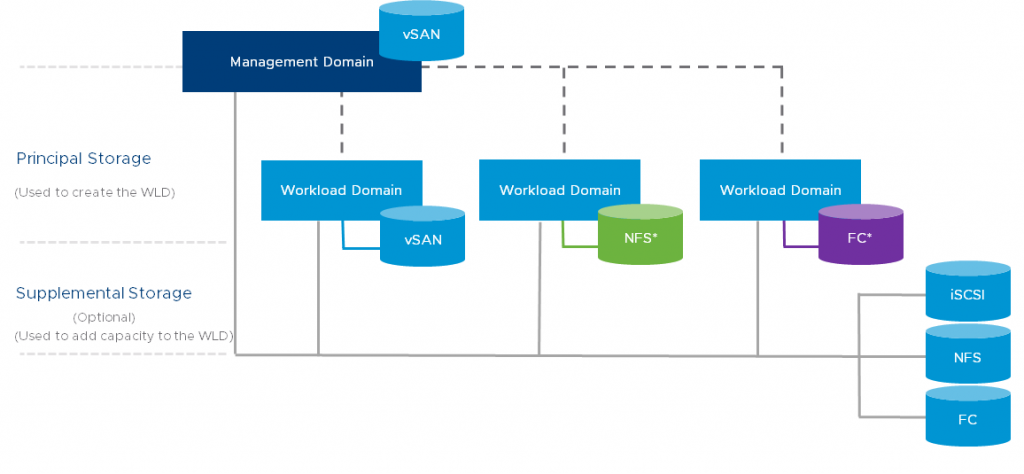
Also remember that with Cloud Foundation, the Management Workload Domain has to run on vSAN, you can not use external storage for this.

So if you want a truly Software Defined Data Center with all the automation of deployment, all the nice built in features for day-2 operations then vSAN is the first choice of storage, if you have existing storage you wish to sweat out whilst you migrate to a full SDDC then that’s supported too, and yes you can have a vSAN cluster co-exist with external storage too, which makes migrations so much easier.

The other aspect to look at this is in a Hybrid Cloud or Multi Cloud strategy, Cloud Foundation is all about providing a consistent infrastructure between your private and public clouds, so if your public cloud is using Cloud Foundation with vSAN then the logical choice is to have vSAN as your storage for your Cloud Foundation Private Cloud to have that consistent infrastructure for your workloads no matter where they may run.

Day-2 Operations – Performance Monitoring in the vSAN UI

Performance reporting or Performance Monitoring is something of a must in any storage environment today, I remember many times when I was in VMware Support when facing a customer storage performance issue that metrics were not there to capture the event, and most storage performance tools required enabling, obviously this meant that the issue had to be occurring at the time of the performance metrics grab, vSAN in the early days was no different, vSAN Observer whilst being a detailed tool and provided a lot of information, was not a historical tool, it was enabled to troubleshoot a performance issue that was happening at that particular time.

In the later releases of vSAN the UI came equipped with more performance metrics than you could shake a stick at, which from a performance troubleshooting and monitoring perspective is the dogs danglies, but what does this mean from an every day perspective?  Before we take a look at the UI, there are three areas where vSAN Performance metrics can be displayed

  • Cluster level – This is the performance metrics aggregated for the whole cluster and allow you to have the high level view of how your cluster is performing as a whole
  • Host Level – This allows you to look at how vSAN is performing on a host by host perspective and contains further information drilling down through things like Disk Groups, Physical Disks, Network Controllers, VMkernel interfaces.
  • VM Level – This focuses on a specific virtual machine and the objects associated with it.

So what information do we have exactly for a given observation level?  Well let’s first of all take a look at the cluster level performance information, there are three options under the performance tab for vSAN

  • vSAN – Virtual Machine Consumption
  • vSAN – Backend
  • vSAN – iSCSI

I have met many customers that immediately notice there is a big difference between the Virtual Machine Consumption and the Backend graphs, so before we go any further let’s talk about what each of these specific areas mean.

Virtual Machine Consumption
These graphs represent the values that objects residing on the vSAN Datastore are seeing, now remember everything that exists on vSAN is an object, so consumers that are counted in these graphs are Virtual Machines, Stats Objects etc

Backend
These graphs represent the backend disks associated with vSAN, cache and capacity

Both sets of graphs cover the statistics for:

  • IOPS
  • Throughput
  • Latency
  • Congestion
  • Outstanding I/O

iSCSI
The iSCSI Performance graphs contain all the graphs above with the exception of Congestion, these graphs are in relation to each iSCSI Target/LUN created and each one is selected in turn to review the performance graphs associated.

If we move our focus to a host level, in here we have a number of options in addition to the three we also see at a cluster level, however there is some additional metrics we get at a host level for Virtual Machine Consumption and Backend, in the Virtual Machine Consumption graph we have Local Client Cache Hit IOPS and Local Client Cache Hit Rate

And under Backend we also have some additional graphs for Resync IOPS, Resync Throughput and Resync LatencyThe resync metrics are extremely important if vSAN is recovering from a failure of some sort and performing a resync of degraded components, it is also important if you are performing a pro-active rebalance, policy change or a full data migration during host or disk/diskgroup evacuation.

The other options listed under host vSAN performance are:

  • Disk Group – Shows the performance graphs for the disk groups, I will cover this below as this is one of the most interesting set of metrics with a lot of detail.
  • Disk – Shows the physical disks in the host reporting on IOPS, Throughput and  Latency
  • Physical Adapters – Shows the network stats for each vmnic associated with vSAN, stats include Packet Loss Rate which is good for troubleshooting networking issues
  • VMkernel Adapters – Shows the statistics for each VMkernel configured for vSAN, this also includes a Packet Loss Rate which you can then use to troubleshoot the software network stack
  • VMkernel Adapters Aggregation – This is an aggregation of all VMkernel interfaces being used for vSAN on the host

Now let’s go back to the Disk Group performance graphs, as I said earlier this is a very interesting group of metrics to explore, so what do we have in this group?  The first section is all about Frontend (Guest) IOPS, Throughput and Latency

The frontend statistics are maybe as you have guessed already, they are related to vSAN Object I/O being generated from guests running within the vSAN cluster.  If we scroll down a little further we can see statistics relating to Overhead IO,  Read Cache Hit Rate (for hybrid) and Evictions:

Further down we have statistics relating to the vSAN Write Buffer and De-stage rate clearly showing how much of the write buffer is free and also how quickly data is being de-staged from cache to capacity, now we also have resync metrics under disk groups, however this differs slightly against the Cluster Wide Backend statistics, in the disk group graphs we actually have values that represent various aspects of the Resync Operations, the graph differentiates between:

  • Policy Changes
  • Repairs
  • Rebalance

So you can easily distinguish what resync operations are happening by the statistics within the disk group stats.

Collection Interval
The vSAN Performance metrics collect the sample every five minutes, and this is an average over that five minute period, if your cluster is hardly doing anything (like my cluster for the screenshots) then this can throw out some of the latency numbers, in my own cluster I have noticed it shows higher latency when doing practically nothing than it does when I start putting load on the cluster.  I have spoken to many customers about this, it is no concern, it just means that during the collection sample maybe a few “Large” IO operations returned a larger Latency and because of the low number of samples, this skews the average, so no cause for alarm on that one.

Up next will be Day-2 Operations, Performance Monitoring with vROPS, I just have to write it first 🙂