Tag Archives: Capacity

What’s happening with Intel Optane?

I have done a lot of testing on Optane SSDs in the past, but in July of 2022 Intel announced their intention to wind down the Optane business. Since that announcement I have had many questions surrounding Optane and where it leaves customers today.

Well firstly, I am going to address the messaging that was announced back in July, on the Intel earnings call it was announced that Optane had been written off with over half a billion dollars. This led to quite a storm of confusion as I was asked by many “Does this mean I cannot buy Optane any more?”

To the contrary, Optane is still a product and will continue to be a product until at least the end of 2025, and even if you buy it on the last day it is available, you will still get a 5 year warranty.

I have never really spoken about the other side of the Optane house on this blog before, moreso because it wasn’t directly relevant to vSAN. However, there are two sides to Optane, of course as you know the SSD, but there is also the persistent memory side of the Optane Technology.

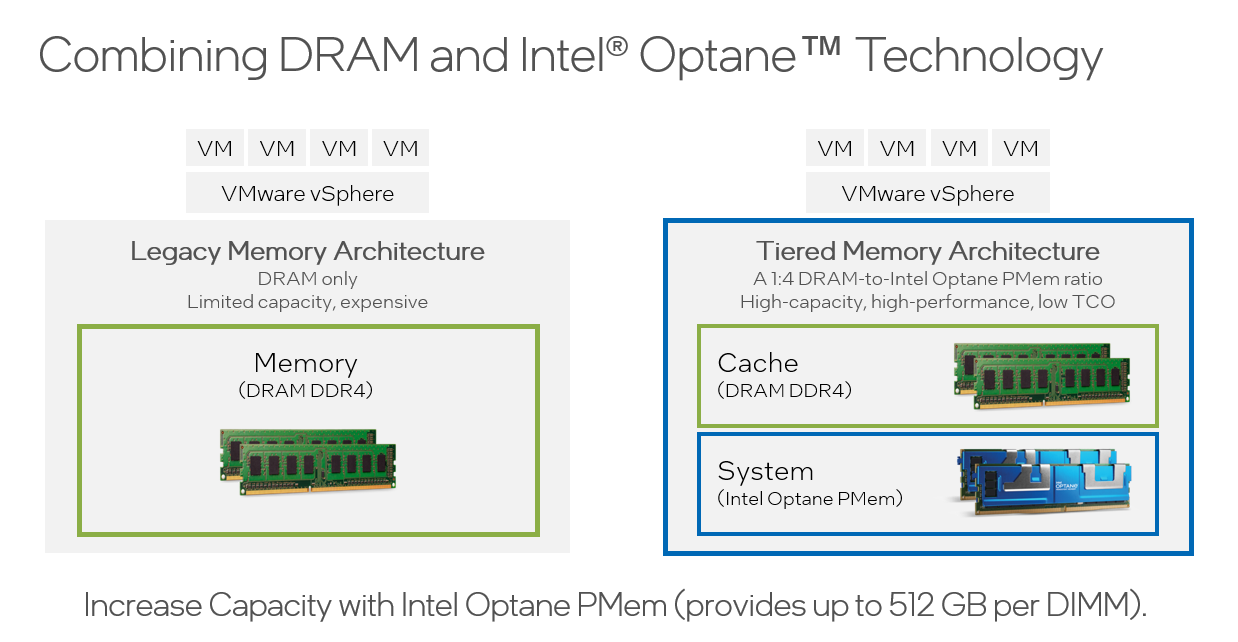
Optane Persistent Memory (PMEM) is primarily used in VMware as a memory tiering solution. Over the past few years DRAM has become expensive, as well as having the inability to scale. Memory tiering allows customers to overcome both of the challenges on cost as well as large capacity memory modules. PMEM for example is available in 128GB, 256GB and 512GB modules, at a fraction of the cost of the same size modules of DRAM.

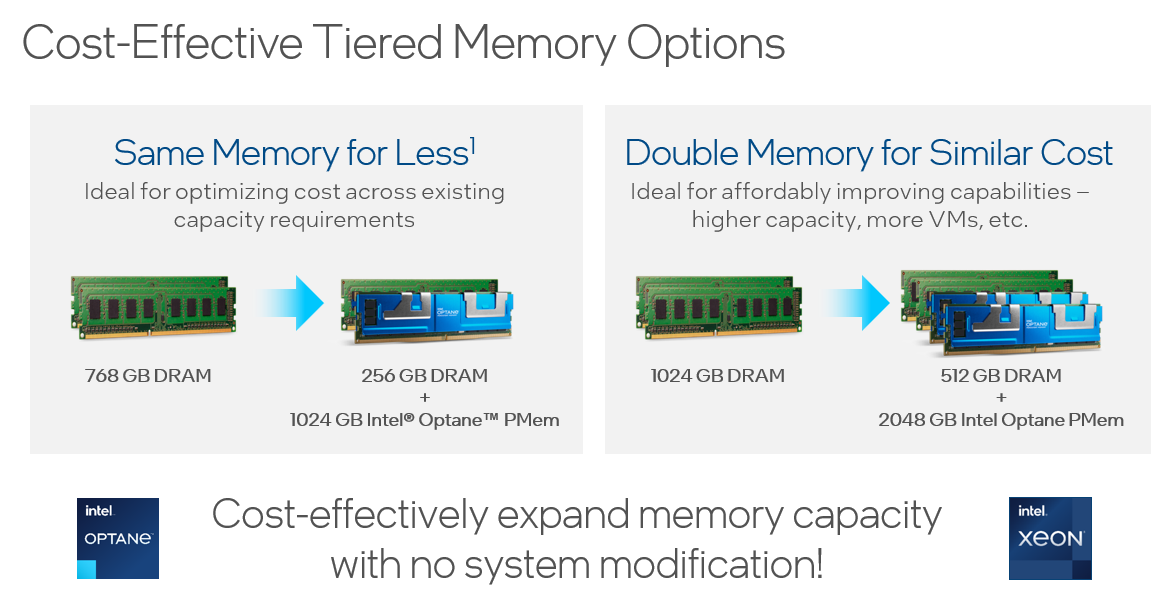
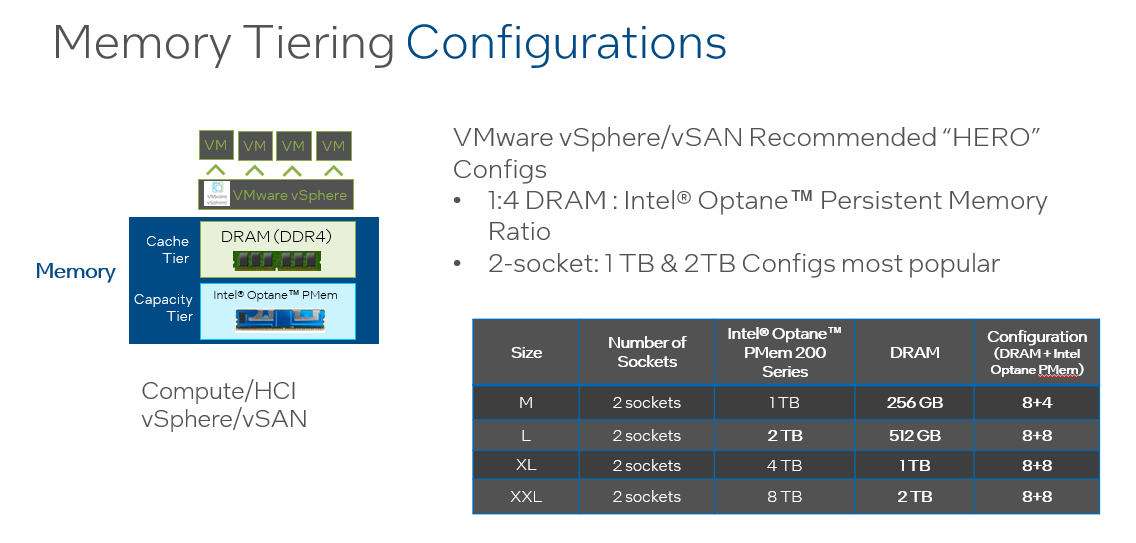
Memory tiering is very much like the Original Storage Architecture in vSAN, you have an expensive cache tier, and a less expensive capacity tier. Allowing you to deliver a higher memory capacity with a much improved TCO/ROI. Below are the typical configurations prior to vSphere 7.0U3.

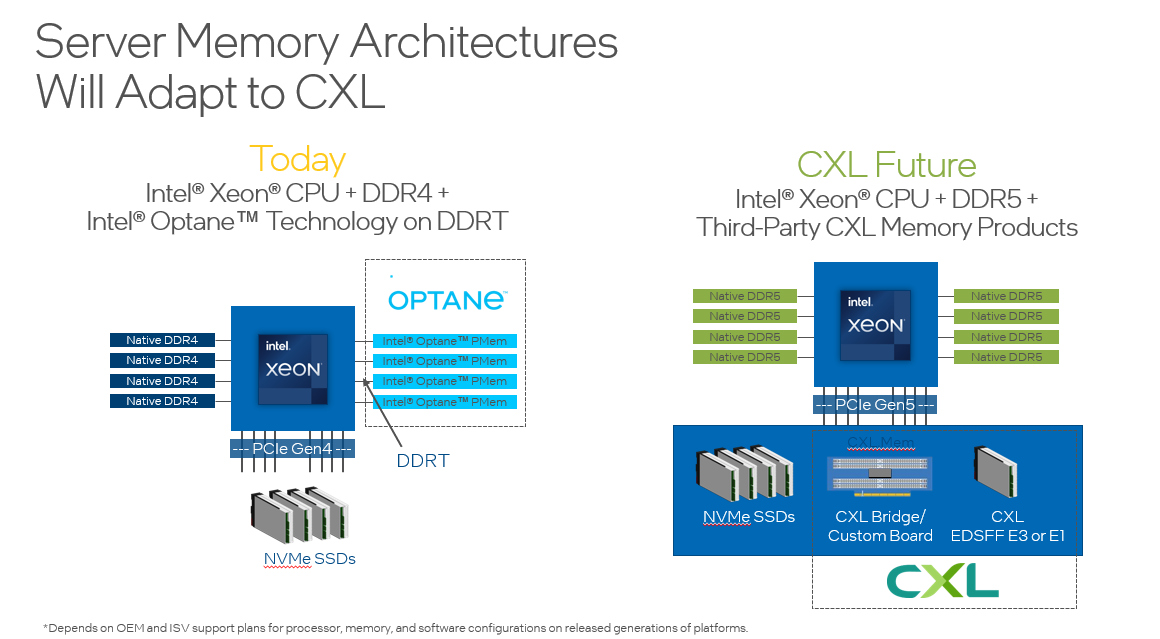
On the horizon we have a new architecture called Compute Express Link (CXL), and CXL 2.0 will deliver a plethora of memory tiering devices. However, CXL 2.0 is a few years away, so the only memory tiering solution out there for the masses is Intel Optane. This is how it looks today and how it may look with CXL 2.0:

I recently presented at the VMUG in Warsaw where I had a slide that states Ford are discontinuing the Fiesta in June 2023, does this mean you do not go and buy one of these cars today? The simple answer is just because it is going away in the future, it still meets the needs of today. It is the same with Optane Technology, arguably it is around for longer than the Ford Fiesta, but it meets the needs to reduce costs today as a bridge to memory tiering architectures of the future with CXL 2.0.

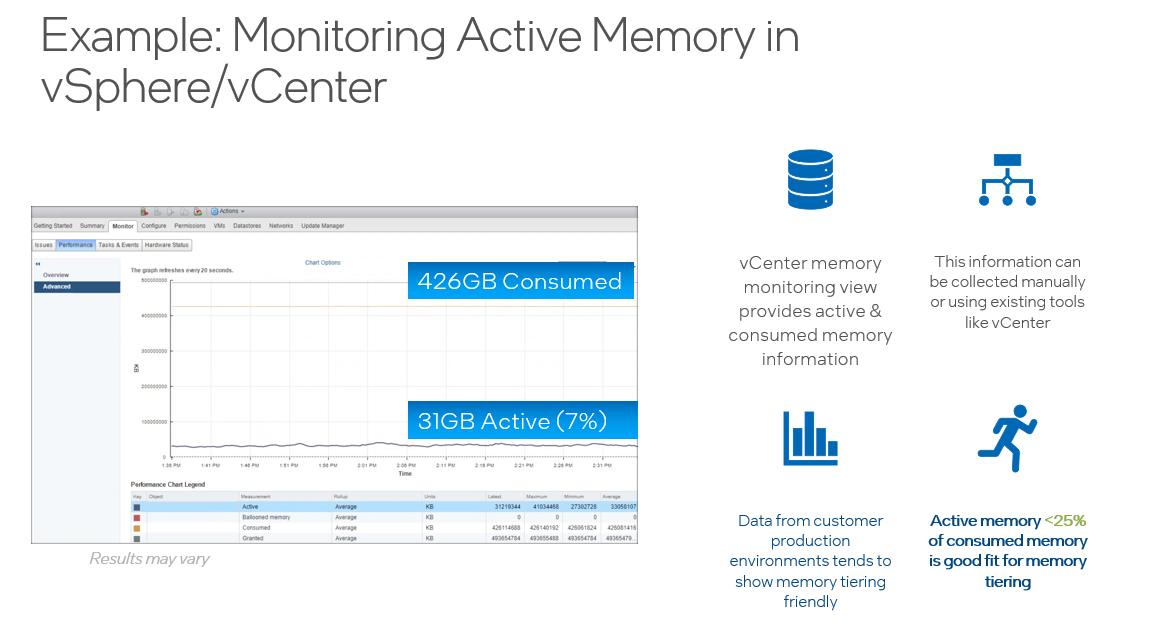
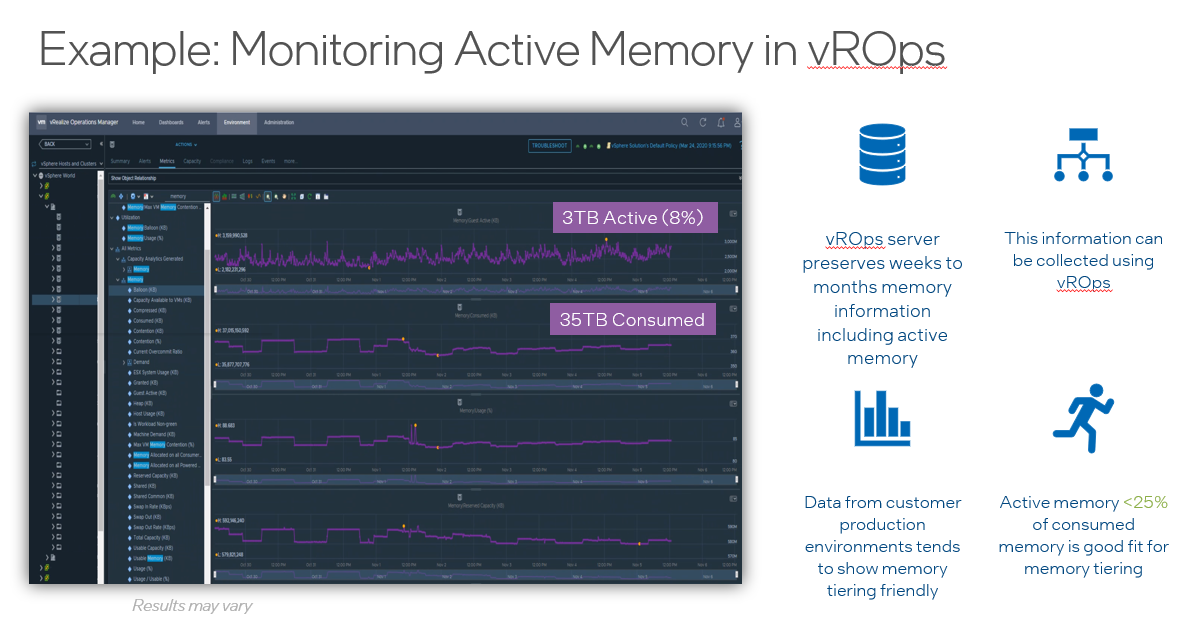
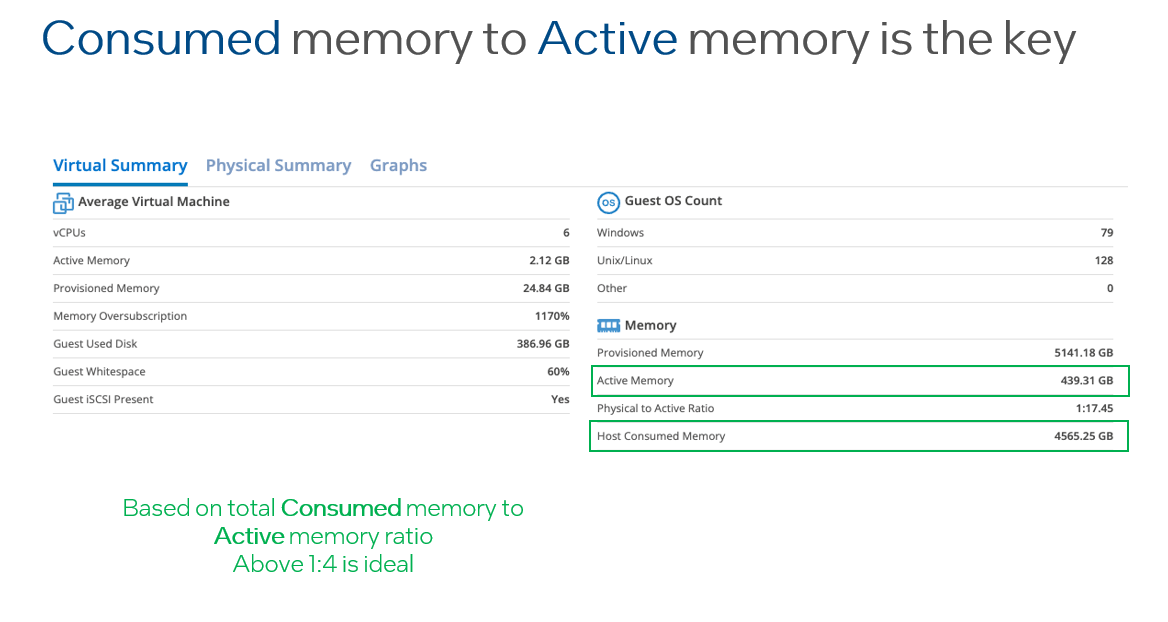
I like to challenge the status quo, so I challenge you to look at your vSphere, vSAN or VCF environments and look at two key metrics. The first one is “Consumed Memory” and the second one is “Active Memory”. If you divide Consumed by Active and the number you get is higher then 4, then memory tiering is a perfect fit for your environment, and not only can you save a lot of your memory cost, but it also allows you to push up your CPU core count because it is a more affordable technology.

Providing your “Active” memory sits within the DRAM Cache, there should be very little to no performance impact, both Intel and VMware have done extensive testing on this.

Proof of Concepts
Nobody likes a PoC, they take up far too much of your valuable time, and time is valuable. I have worked with many customers where they have simply dropped in a memory tiering host into their existing all DRAM based cluster and migrated real workloads to the memory tiered host. This means no synthetic workloads, and the workloads you migrate to evaluate can simply be migrated back.

Conclusion
Optane is around for a few years yet, and even though it is going to go away eventually, the benefits of the technology are here today, in preparation for the architectures of the future based on CXL 2.0. Software designed to work with memory tiering will not change, it is the hardware and electronics that will change, so it protects the investment in software.

Optane technology is available from all the usual vendors, Dell, HPE, Cisco, Lenovo, Fujitsu, Supermicro are just a few, sometimes you may have to ask them for it, but as they say….”If you do not ask, you do not receive”.

Optane Performance

Many times over the past few months I have been asked about the benefits of using Intel Optane NVMe in a vSAN environment, although there was marketing material from Intel that boasted a good performance boost I decided (purely out of curiosity) to do some performance benchmarking and compare Optane as the cache devices versus SAS as the cache devices. The performance benchmark test used exactly the same servers and networking in order to provide a level playing field, the only thing that was changed was the cache devices being used in the disk groups.

Server Specification:

  • 6x Dell PowerEdge R730xd
  • Intel Xeon CPU E5-2630 v3 @ 2.40GHz
  • 128GB RAM
  • 2x Dell PERC H730 Controllers
  • 2x Intel Dual Port 10Gb ethernet adapters (Configured with LACP)

Disk group config for the SAS test:

  • 3x Disk Groups
  • 3x 400GB SAS SSD per disk group
  • 1x 400GB SAS SSD per disk group

Disk group config for the Optane test

  • 2x Disk Groups
  • 3x 400GB SAS SSD per disk group
  • 1x 750GB Optane NVMe P4800X per disk group

Whilst you could say that the configurations are not identical, since the Write Buffer is limited to 600GB per disk group then both configurations have the same amount of write buffer, the SAS config has more backend disks which would serve as an advantage.

For the purpose of the Benchmark, we used HCI Bench to automate the Oracle VDBench workload testing and each test was based on the following, the test was designed to max-out the system hence the high number of VMDKs used here (250)

  • 50 Virtual Machines
  • 5 VMDKs per virtual machine
  • 2 threads per VMDK
  • 20% working set
  • 4k, 8k, 16k, 32k, 64k and 128k block size
  • 0%, 30%, 70%, 100% write workload
  • 900 second test time for each test

So what were the results?

4K Blocksize:

8K Blocksize:

16K Blocksize:

32K Blocksize:

64K Blocksize:

128K Blocksize:

As you can see Optane really did boost the performance even though the server platform wasn’t the ideal platform for the Optane devices (Dell said those cards will not be certified in the 13G platform), however despite the fact that the workload was designed to max-out the system, in some cases latency was reduced to almost a third and throughput was was increased in some cases to 3x.

Conclusion: Optane really does live up to expectations, and it isn’t just marketing, I have yet to test a full NVMe system to see how much it can really be pushed, but I hope the numbers above go someway to convice you why you should consider optane as the cache tier in vSAN.

Day-2 Operations – vSphere built in vROPS dashboards

At VMworld I ran a few sessions on Day-2 Operations which I also covered the new built in dashboards for vROPS which were introduced with the fully baked HTML5 client in vSAN/vSphere 6.7.  Many people were not aware of the dashboards and moreso were not aware that these vSAN specific dashboards continue to work even after the 90 day trial period has expired.  Not only that but VMware has done a great job in automating a deployment of vROPS if you have not already got an appliance deployed.  So let’s take a look at these new dashboards in a bit more detail.

Firstly the three vSphere operations Dashboards, the default one that loads up is an overview dashboard of all your clusters:

Then there is the Cluster Level View where you pick a specific cluster:

And finally is the Alerts view…Great timing, I have a physical disk failure in the vSAN Cluster:Now the above three dashboards will no longer be available after the 90 day trial period has expired, and also the link to the vRealize Operations appliance will not be functional either, but after the 90 day trial period has expired, the following three vSAN Dashboards will still be fully functional and available, so let’s look at those in a bit more detail:

The vSAN Overview dashboard, like the vSphere overview dashboard, displays information at a holistic level for all of your vSAN Clusters within this particular vCenter server, you will see that the dashboard provides information on how many clusters are running dedupe/compression, or how many of the clusters are a Stretched Cluster for example.  The dashboard also shows if you need to investigate any current alerts (yes I cleaned up the failed disk before grabbing this screenshot).

The next dashboard we choose a specific cluster to look at in more detail:
In this dashboard we see information pertaining to a specific cluster, we can see that I have 6 critical alerts which we will take a look at next, but there are some key metrics here that from an operational perspective are pretty important from a day-2 operations standpoint:

  • Remaining Capacity
  • Component Limit
  • IOPS, Throughput and Latency statistics
  • Read versus Write latency

The last dashboard is alerts:
Here we can see the current alerts that have been triggered for each cluster which may need to be addressed, the critical alerts previously highlighted in the cluster view were all related to a network redundancy lost when I was troubleshooting packet loss on the physical switch.

So as you can see there’s a really good amount of detail in the vSphere UI relating to vROPS making the day-2 operations a lot easier to perform.