As the workloads of AI systems increase in complexity, more powerful and sophisticated infrastructure is required to support them. Modern applications of artificial intelligence necessitate improved speeds, dependability, scalability, and safety. Therefore, both corporations and academic institutions have made the search for the best platform to execute these demanding tasks a top priority.
Here we have a technological match made in heaven: VMware vSAN and Intel Gen 4 Xeon Scalable processors. This potent union creates a superb environment for processing AI workloads. Each has its own advantages, but when combined they provide a solid foundation for AI. Let’s find out!
Benefits of running AI workloads on VMware vSAN
The scalability and adaptability required by AI workloads are met by vSAN. It reduces overhead by making it easier to provision and manage storage resources. It provides high performance and availability and scales well in both directions. Key advantages include the following:
- Simplified Management: vSAN consolidates storage and compute into a single pool that can be administered with standard VMware tools like vSphere Client, vRealize Operations, and PowerCLI.
- Lower TCO: vSAN reduces TCO by doing away with the need for costly storage area network (SAN) or network-attached storage (NAS) devices by pooling together in-server, direct-attached storage devices.
- Scalability: Since AI workloads tend to grow unexpectedly, it’s important to have a platform that can easily scale to accommodate this growth, and vSAN provides this.
- Data Protection and Security: vSAN’s native vSphere integration means it can be used with vSphere Replication and Site Recovery Manager to provide encrypted data at rest and disaster recovery.
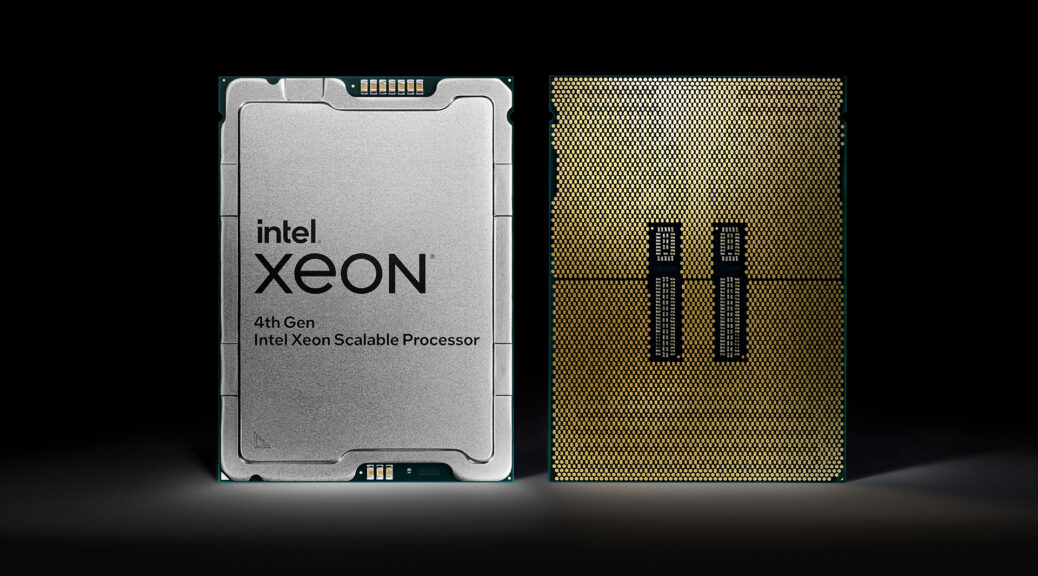
Advantages of Intel Gen 4 Xeon Scalable Processors
The new Intel Gen 4 Xeon Scalable processors have powerful artificial intelligence (AI) accelerators (AMX and DSA) built into their architecture.
- Advanced Matrix Extensions (AMX): The Xeon Scalable processor has had its capabilities enhanced with new matrix extensions designed specifically for artificial intelligence and high-performance computing. They provide more parallelism and vectorization, which improves the efficiency of deep learning and machine learning programmes.
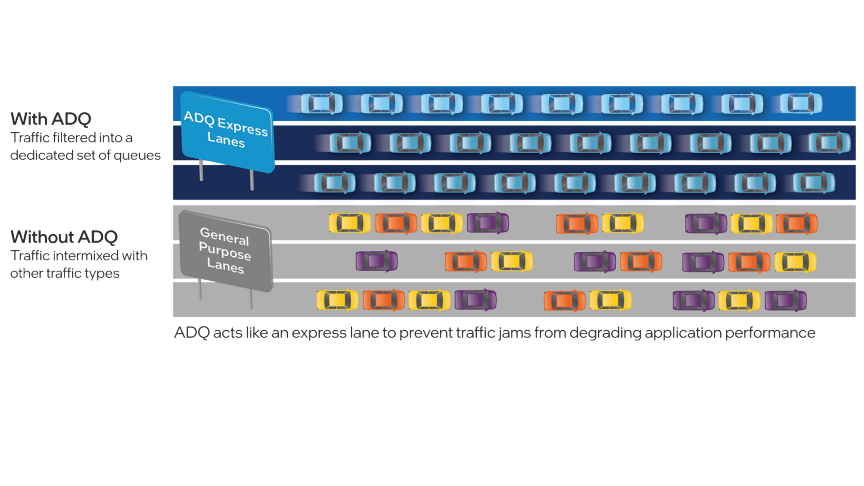
- Data Streaming Accelerator (DSA): This is a hardware accelerator designed to process data quickly and with minimal delay. DSA is essential for processing the large amounts of data inherent in AI workloads due to its ability to improve compression, storage efficiency, and security.
The Perfect Synergy for AI Workloads
Companies can run AI workloads with confidence on a scalable, secure, and robust platform thanks to the combination of vSAN and Intel Gen 4 Xeon Scalable processors.
Businesses can quickly scale to meet the demands of AI applications thanks to the scalability, ease of management, and cost-effectiveness of vSAN and the AI-tailored hardware acceleration of Intel Gen 4 Xeon Scalable processors. In addition to providing an ideal platform for AI, this potent combination simplifies data management, reduces overhead, and boosts performance.
Additionally, sensitive data used in AI workloads is safeguarded with in-built security and encryption features, allowing for both regulatory compliance and peace of mind.
When put together, VMware vSAN and Intel Gen 4 Xeon Scalable processors create a highly reliable, fast, and scalable environment for AI workloads. Organizations can forge ahead with their AI initiatives with the assurance that their infrastructure can handle the rigours of AI by taking advantage of vSAN and the AMX and DSA accelerators on the Intel CPU.