I have many conversations with many people, whether they be customers, friends, colleagues, potential customers but the question is always the same, does vSAN really scale linearly?
So to answer this question, I have access to an 8-Node cluster which I essentially removed four of the nodes and ran a performance test usinc HCI Bench, for the 4-Node cluster I ran a total of 120 VMs and for scalability reasons 240 VMs in the 8-Node cluster.
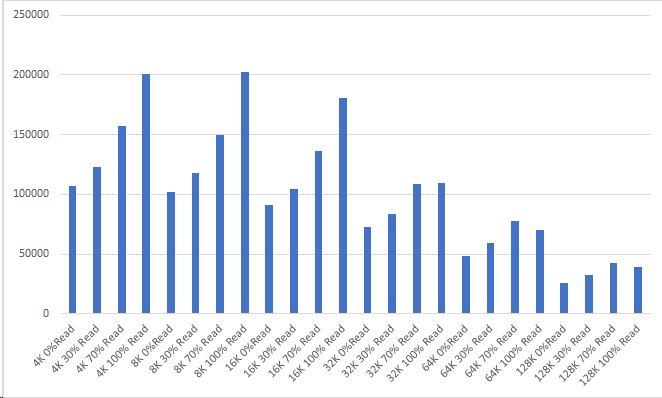
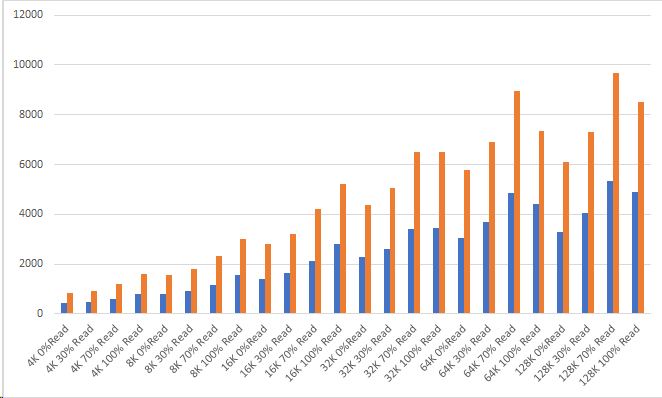
For the purpose of the test, I wanted to run all the performance tests I have ran previously so all block sizes up to 128K as well as Read/Write percentages of 0%, 30%, 70% and 100%, so let us take a look at the 4-Node performance:
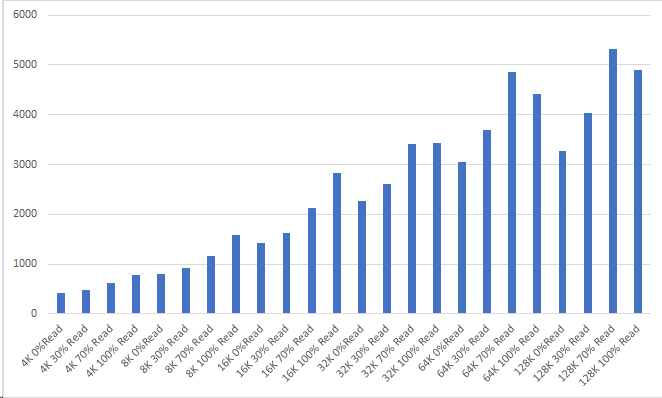
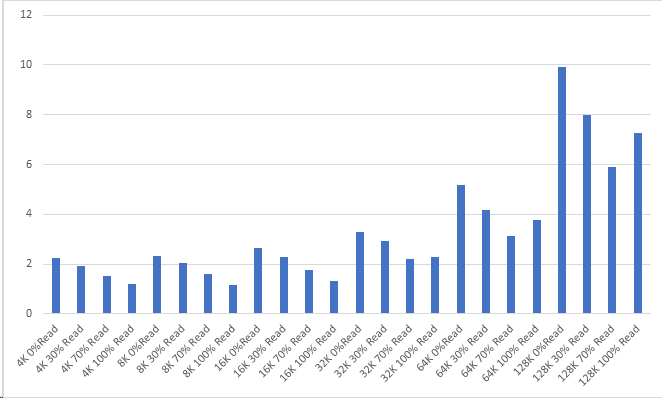
IOPS of the 4 Node ClusterThroughput in MB/secLatency in ms
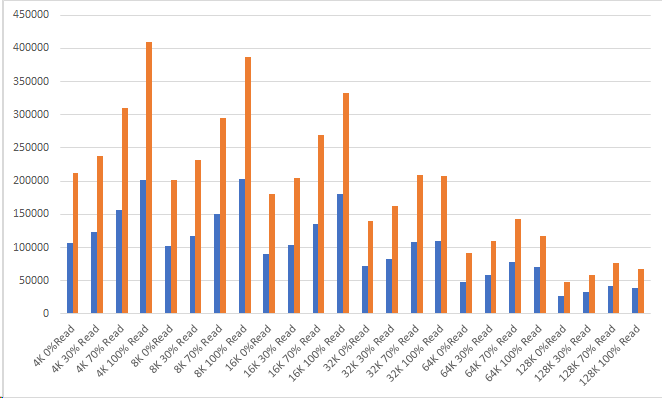
As you can see even the four node cluster was pretty performant and we can see that the four node cluster can quite easily achieve in excess of 200K IOPS on reads, and 150K IOPS on 70/30 split, so what happens when we add another 4 nodes to the cluster?
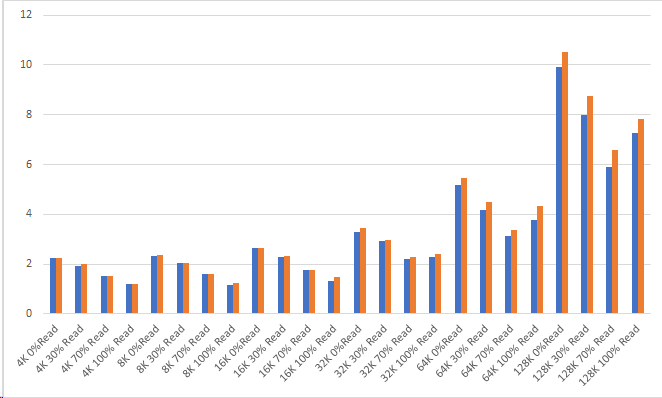
IOPSThroughput MB/secLatency
So as you can see from both the tests, latency was pretty much similar in both sets of tests indicating it was a pretty comparable test, so the IOPS and Throughput was more or less double when doubling the size of the cluster proving that vSAN does scale linearly. I would have liked to have had an additional 8-nodes to show further scaling, but in all the customers who I have spoken to about increasing their cluster sizes, they confirm that it scales linearly.
I had the privilege recently to work with a customer who had asked HPE to perform some performance benchmarks not just with HCI Bench, but because they run quite a lot of Oracle workloads they wanted to determine if the performance of vSAN on HPe Synergy would be sufficient in order to run their workloads.
Whilst agreeing on the hardware specification, the customer had referenced my previous post on Optane™ Performance and had asked HPE to perform the tests using Optane™ as the cache tier in the Synergy configuration, this was not only to provide a superior performance experience, but it also would free up two capacity slots in the disk tray of the chassis per Synergy compute node meaning the customer could have more capacity.
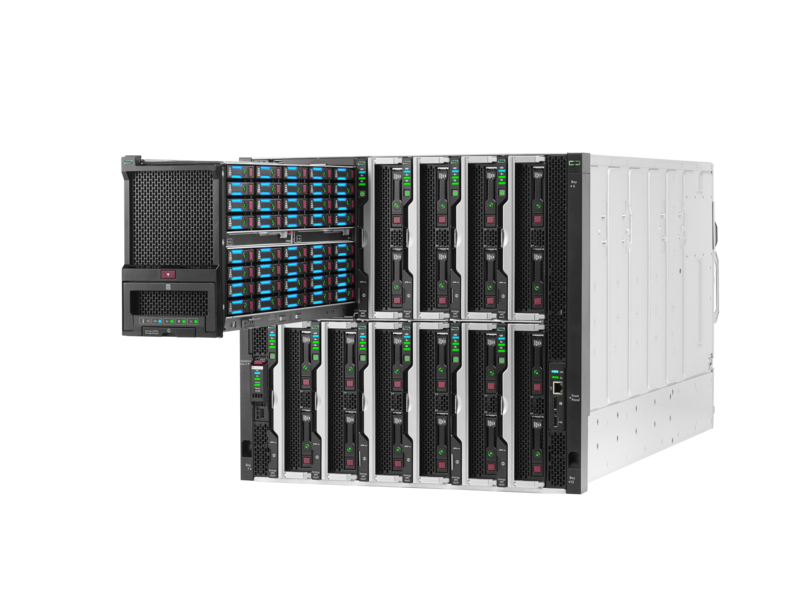
Synergy Specification:
HPE Virtual Connect SE 40Gb F8 Module for Synergy
HPE Synergy D3940 Storage Module with SAS expanders
3x HPE Synergy 480 Gen10 nodes, each equipped with:
2x Intel® Xeon® Gold 6154 CPU @ 3.00GHz
2x Intel® Optane™ 750 GB SSD DC P4800X Series PCIe (x4)
768 GB Memory (24x 32 GB RDIMM @ 2666 MHz)
2x Disk Group config with 1x Optane + 3x 800GB SAS per Disk Group
LACP based 40GbE interconnection between Compute Nodes
Please note: At the time of writing the 750GB U.2 Optane drives were undergoing certification for HPE Synergy.
In order to perform the Oracle workload testing HPE engaged with their own internal Oracle specialists to determine the correct workloads that needed to be performed, and with a target of <2ms specified by the customer they decided to use Kevin Closson’s SLOB tool, SLOB was configured in the following way:
128 SLOB Schemas
Each Schema was 8GB in Size
Total of 1TB Test data
For the purpose of testing HPE decided that they would perform different tests in the following way:
(A) Single Oracle VM Instance with 128 Schemas, 70% Read, 30% Write
(B) Single Oracle VM Instance with 128 Schemas, 50% Read, 50% Write
(C&D) Single Oracle VM Instance with Heavy REDO activity and Large SGA and REDO_STRESS=Heavy, 50% Read, 50% Write, with 128 Schemas and 32 Schemas
(E) Single Oracle VM Instance
(F & G) 2 Parallel Oracle VM Instances with 64 / 128 Schemas Each, 70% Read, 30% Write
Test
SGA
PGA
Schemas
Scale
REDO_STRESS
A
5G
1G
128
8G
Lite
B
5G
1G
128
8G
Lite
C
256G
100G
128
8G
Heavy
D
256G
100G
32
8G
Heavy
E
5G
1G
128
8G
Lite
F
5G
1G
64
8G
Lite
G
5G
1G
128
8G
Lite
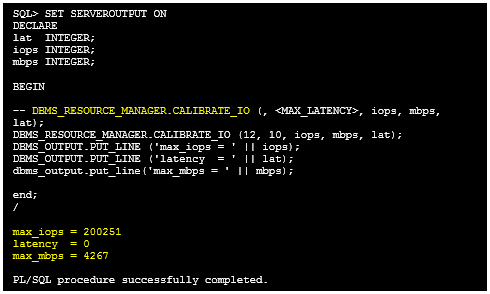
Before the tests were performed, and Oracle I/O Calibration was performed which is a feature of Oracle Databases and is used to assess the performance of the I/O subsystem by issuing an I/O intensive read-only workload in order to determine the maximum IOPS and throughput whilst maintaining close to 0ms latency.
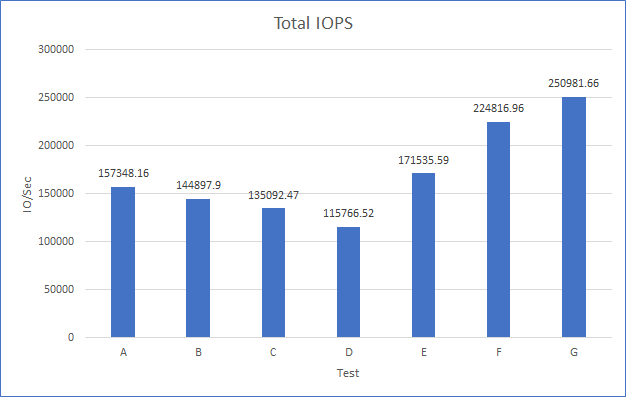
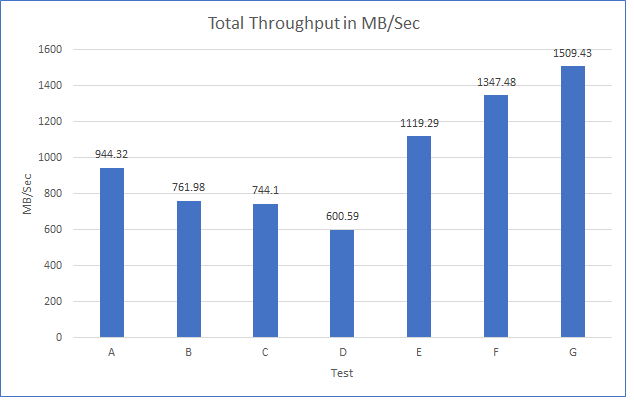
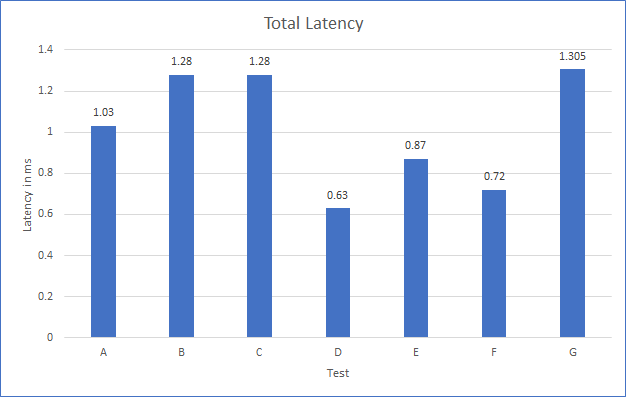
Each test ran for 60 minutes in order to ensure enough data was filling up the write buffer, so let’s take a look at the results:
As you can see from the results, the target of <2ms was achieved successfully and at one point with two oracle VMs achieveing a staggering 250k IOPS at 1.305ms latency is very impressive across a 3-Node cluster, not only was the customer pleased with the results, but the Oracle Specialist within HPE said that the results exceeded their expectations also.
So as you can see, a composable infrastructure deployment of vSAN such as HPE Synergy with Intel Optane™ can still deliver the same levels of performance as standard rack mount servers, combined with VMware Cloud Foundation delivering a full SDDC package from both a hardware and software perspective.
Many times over the past few months I have been asked about the benefits of using Intel Optane NVMe in a vSAN environment, although there was marketing material from Intel that boasted a good performance boost I decided (purely out of curiosity) to do some performance benchmarking and compare Optane as the cache devices versus SAS as the cache devices. The performance benchmark test used exactly the same servers and networking in order to provide a level playing field, the only thing that was changed was the cache devices being used in the disk groups.
Server Specification:
6x Dell PowerEdge R730xd
Intel Xeon CPU E5-2630 v3 @ 2.40GHz
128GB RAM
2x Dell PERC H730 Controllers
2x Intel Dual Port 10Gb ethernet adapters (Configured with LACP)
Disk group config for the SAS test:
3x Disk Groups
3x 400GB SAS SSD per disk group
1x 400GB SAS SSD per disk group
Disk group config for the Optane test
2x Disk Groups
3x 400GB SAS SSD per disk group
1x 750GB Optane NVMe P4800X per disk group
Whilst you could say that the configurations are not identical, since the Write Buffer is limited to 600GB per disk group then both configurations have the same amount of write buffer, the SAS config has more backend disks which would serve as an advantage.
For the purpose of the Benchmark, we used HCI Bench to automate the Oracle VDBench workload testing and each test was based on the following, the test was designed to max-out the system hence the high number of VMDKs used here (250)
50 Virtual Machines
5 VMDKs per virtual machine
2 threads per VMDK
20% working set
4k, 8k, 16k, 32k, 64k and 128k block size
0%, 30%, 70%, 100% write workload
900 second test time for each test
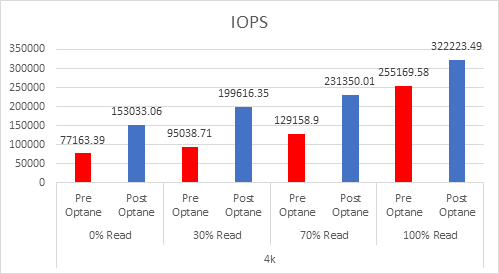
So what were the results?
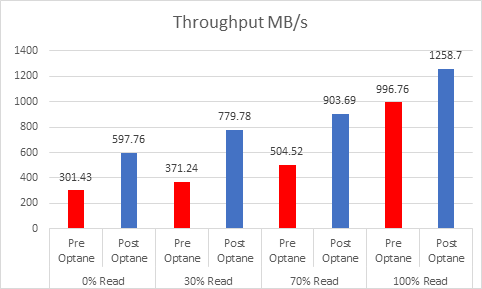
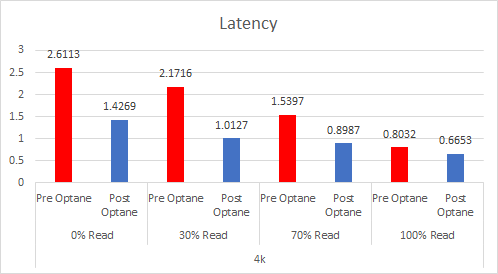
4K Blocksize:
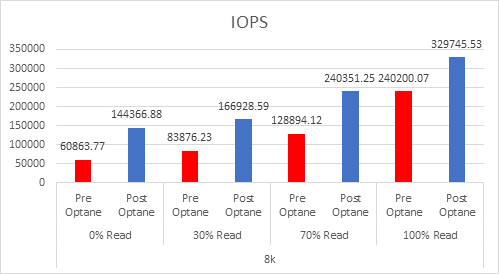
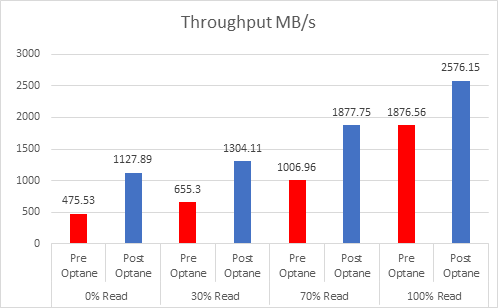
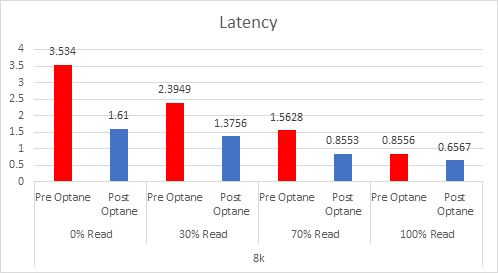
8K Blocksize:
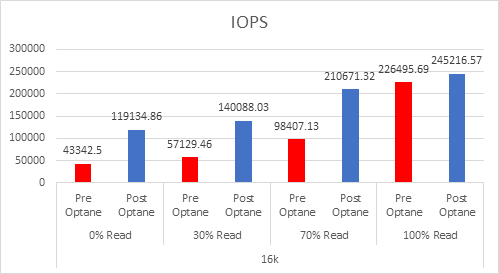
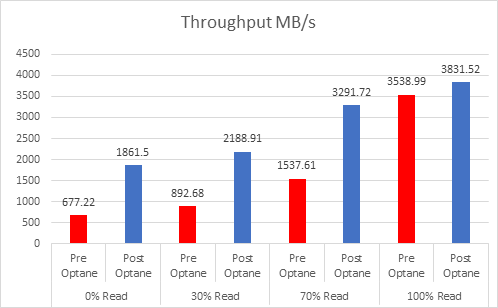
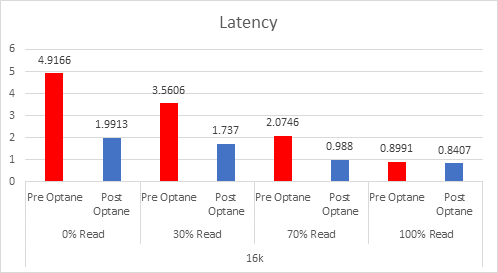
16K Blocksize:
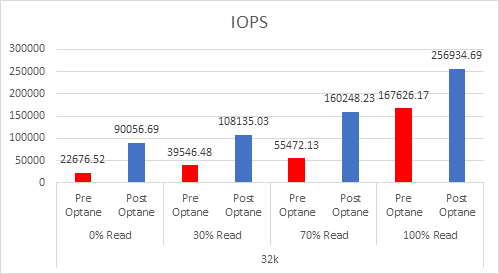
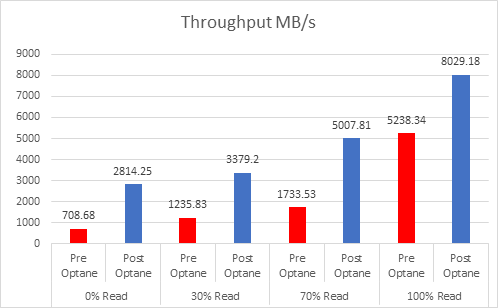
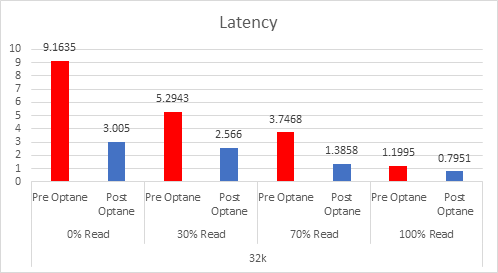
32K Blocksize:
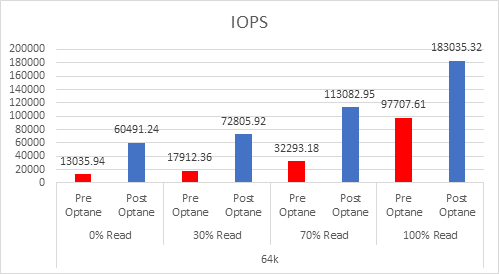
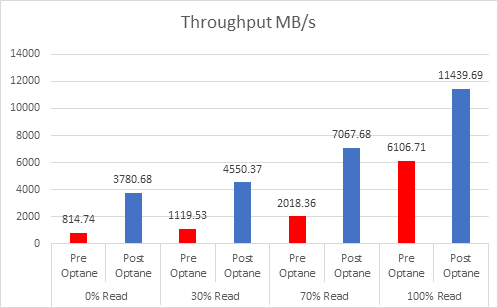
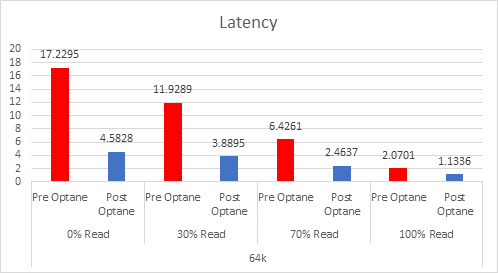
64K Blocksize:
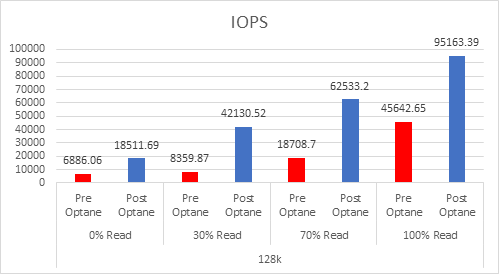
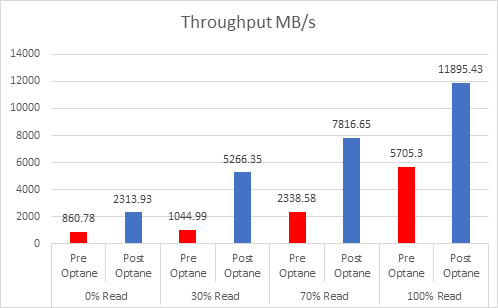
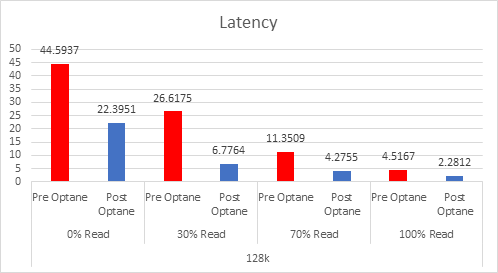
128K Blocksize:
As you can see Optane really did boost the performance even though the server platform wasn’t the ideal platform for the Optane devices (Dell said those cards will not be certified in the 13G platform), however despite the fact that the workload was designed to max-out the system, in some cases latency was reduced to almost a third and throughput was was increased in some cases to 3x.
Conclusion: Optane really does live up to expectations, and it isn’t just marketing, I have yet to test a full NVMe system to see how much it can really be pushed, but I hope the numbers above go someway to convice you why you should consider optane as the cache tier in vSAN.