Tag Archives: Deployed

Day-2 Operations – Capacity Reporting

One of the challenges in storage history is being able to see what exactly is consuming the capacity on a particular datastore, even in my VMware Support days asking the question to a customer would result in a response of “I don’t know exactly”.  This all changed with vSAN, it was recognize that providing a bit more granularity about what exactly is consuming the space on my datastore can offer some really good insights and explanations to the question “Where has my space gone?”

Built into the standard UI for vSphere/vSAN, located under the Monitor/vSAN section is a screen called “Capacity”, and just like the title, it does exactly that, it reports on your capacity as well as giving a breakdown as to what is using the capacity, before we talk about that a bit further, let’s start with the basic fundamental requirements of capacity reporting and that is:

  1. What capacity do I have in total?
  2. What capacity have I used?
  3. What capacity have I got free?
  4. What space savings have I got with dedupe/Compression?

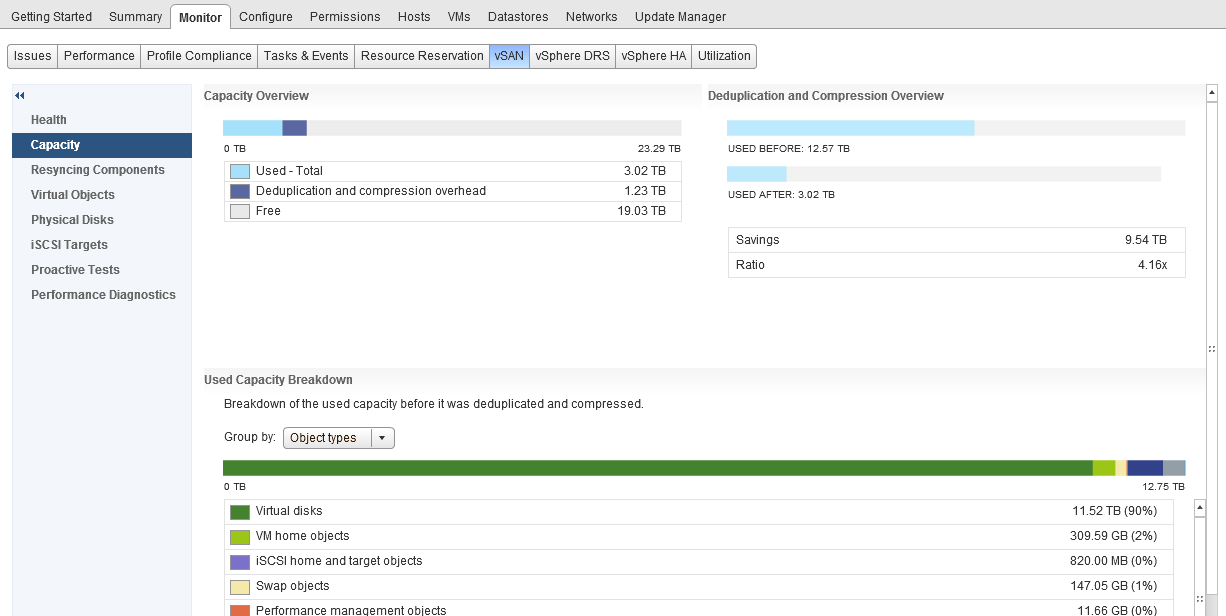
One thing I want to call out which is a question I get asked pretty much most of the time and it is the “Deduplication and Compression overhead” value, as you can see from the above screenshot, in my cluster this is 1.23TB of space, now if you do the math you can work out that this is around 5% of my datastore capacity.  This value will not change as my dedupe/compression ratio increases or decreases.  The only time this value will increase is if I add more capacity (by adding more disks with new disk groups) as the value is around 5% of the overall datastore capacity.

As you can see from the above screenshot the UI answers the fundamental questions right away without any question, but what if your datastore is pretty full and your boss comes over to you and asks you to give them some detail about what is consuming the space?  Well further down the screen is a bit more detail as to the breakdown of consumption:

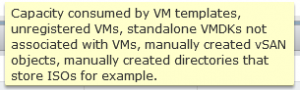
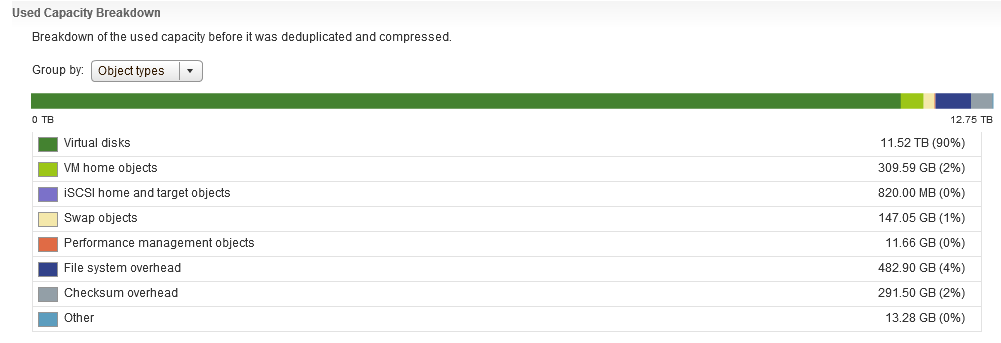
As you can clearly see there’s a pretty detailed list of consumers for my vSAN datastore, and as an extra bonus, when you hover over an item, it gives a bit more detail about what exactly counts as part of that item, if you take “Other” for example:

One thing that you will immediately notice here is that there is no category for Snapshots, now I remember in my support days, Snapshots were any administrators nightmare, especially when you have inadvertently ran your Exchange server on snapshots for almost 12 months without knowing, so in my opinion that is some important detail that is missing here and that feedback has been provided.

Capacity Reporting in vRealize Operations
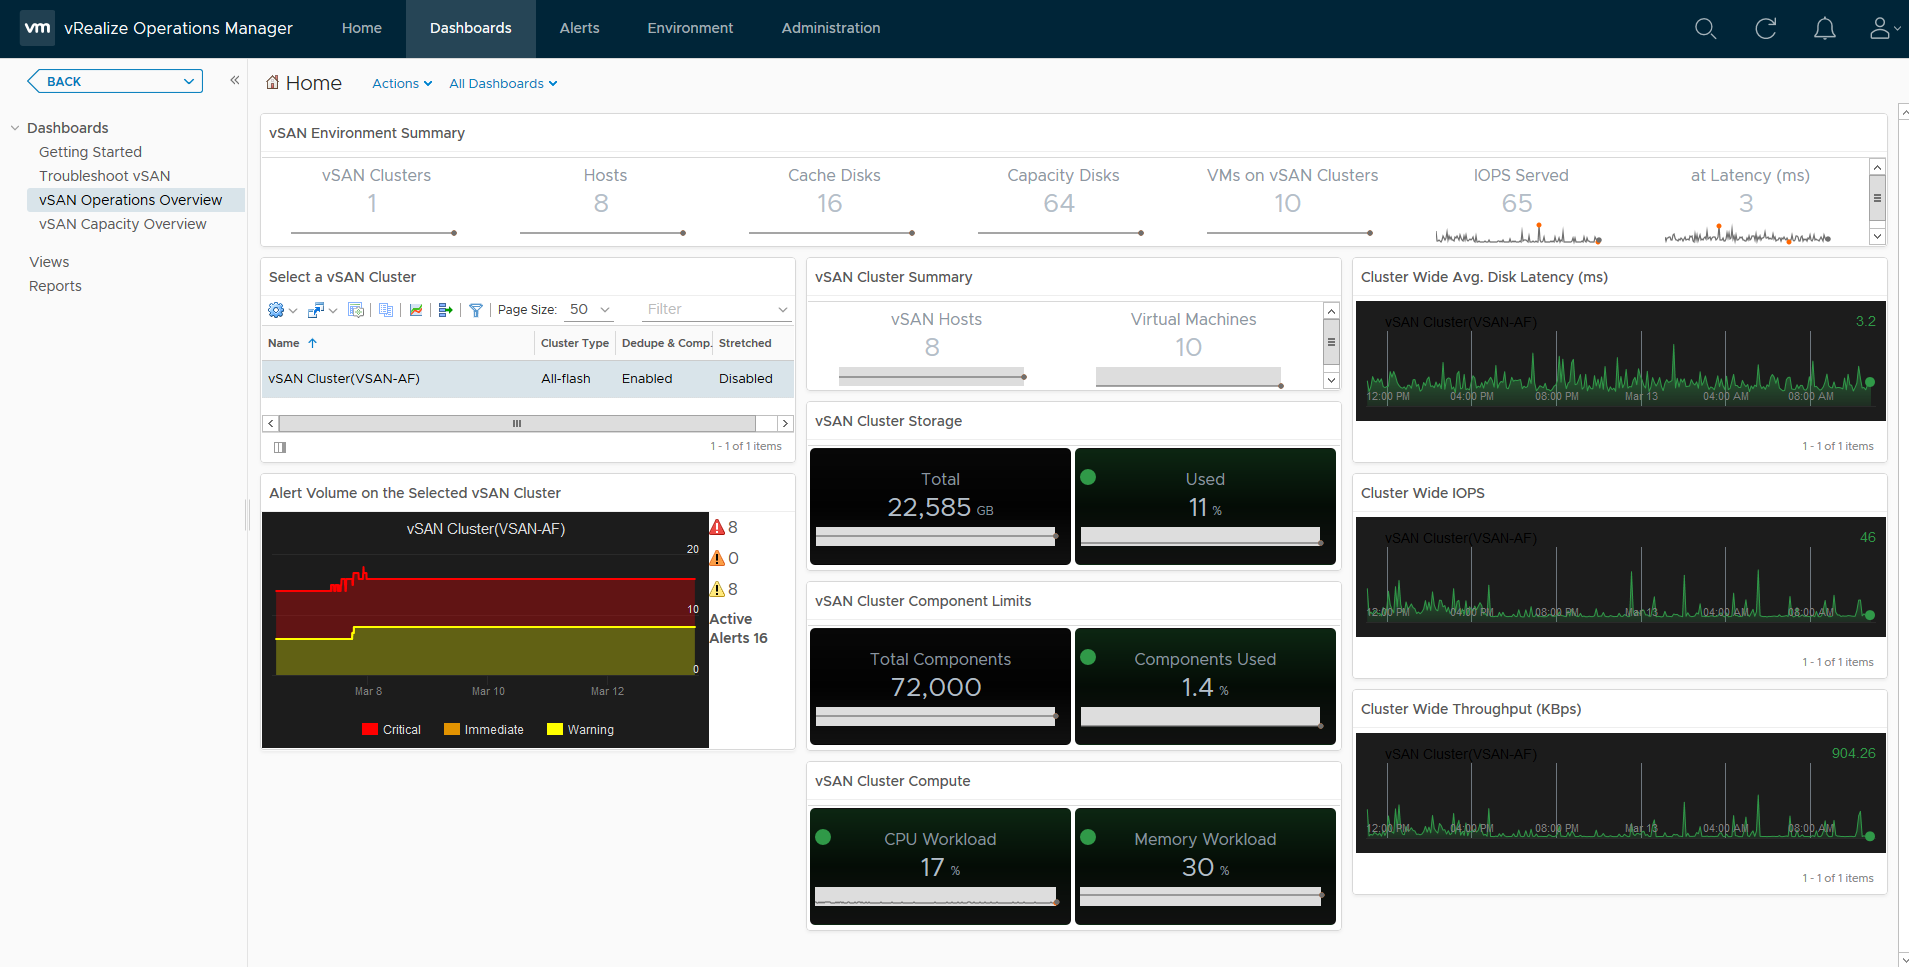
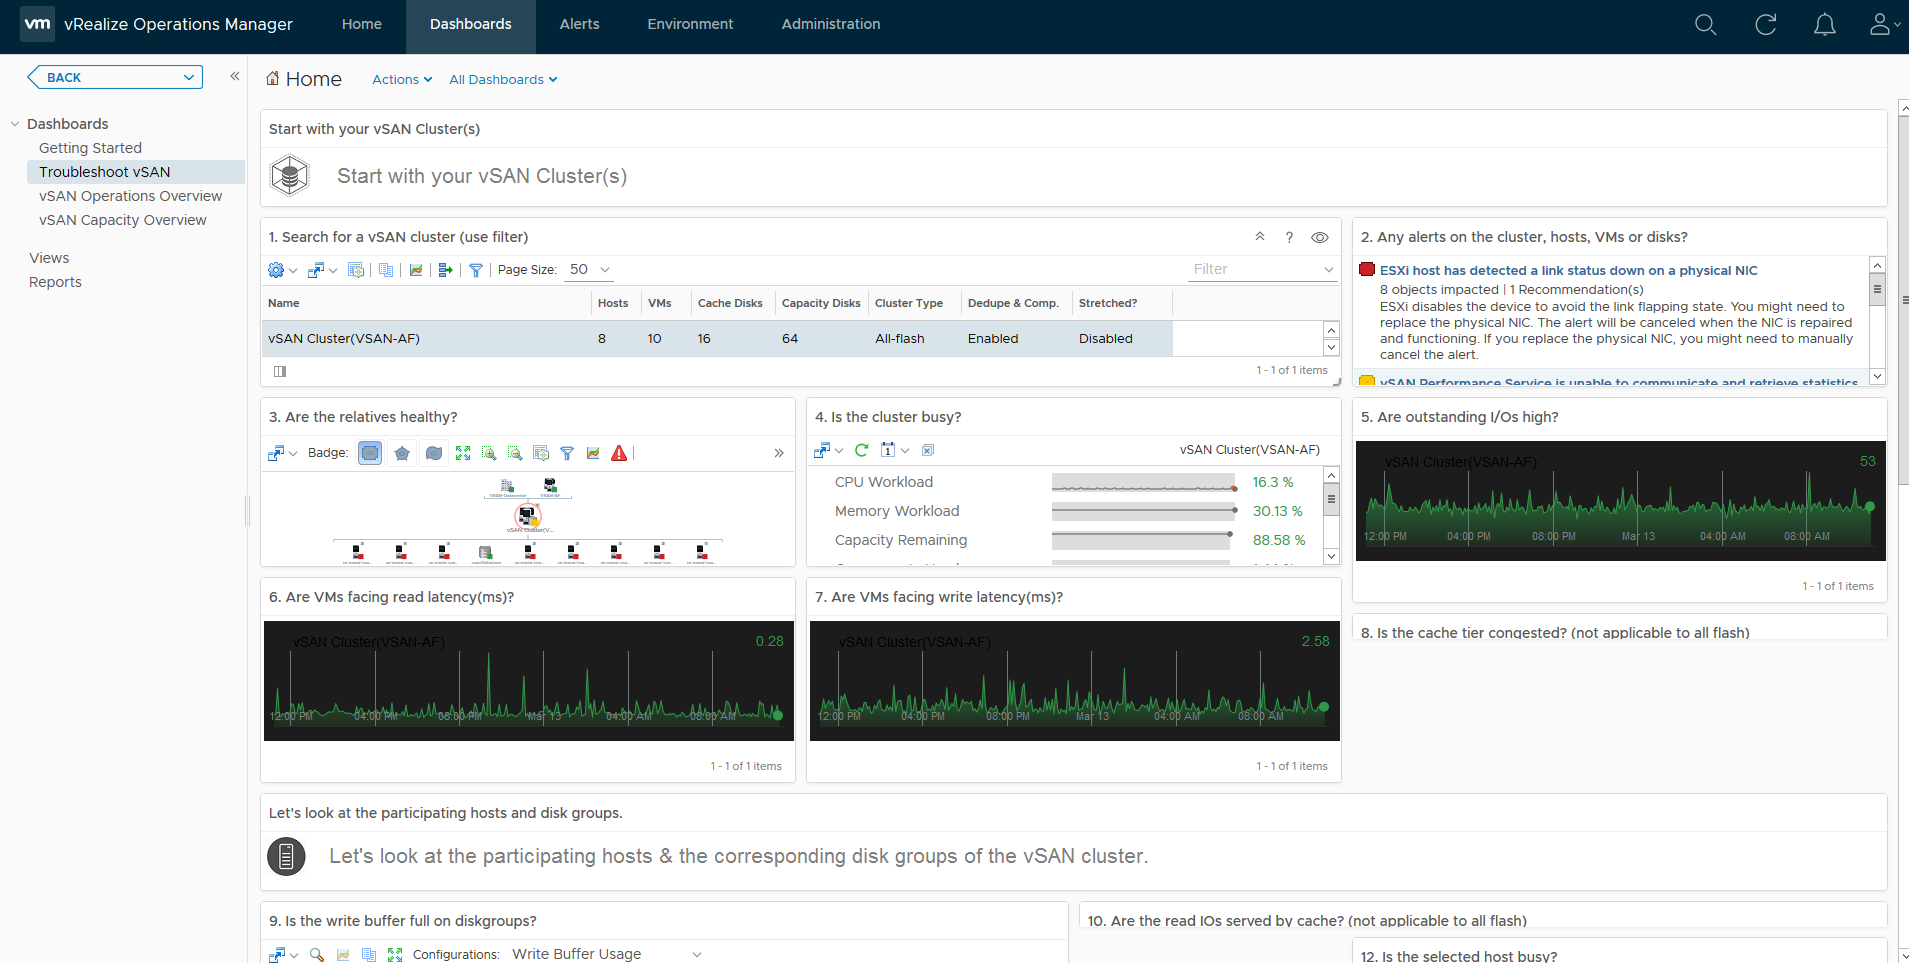
Now vROPS doesn’t go into the level of detail about what exactly is consuming the space on the vSAN Datastore but it offers another insight as to capacity usage.  Unlike the capacity reporting screen within the vSphere UI for vSAN which only provides a point in time view of your capacity, vROPS gives you historical data, lets firstly take a look at what the dashboard looks like:

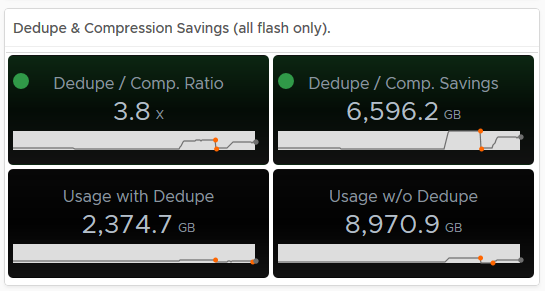
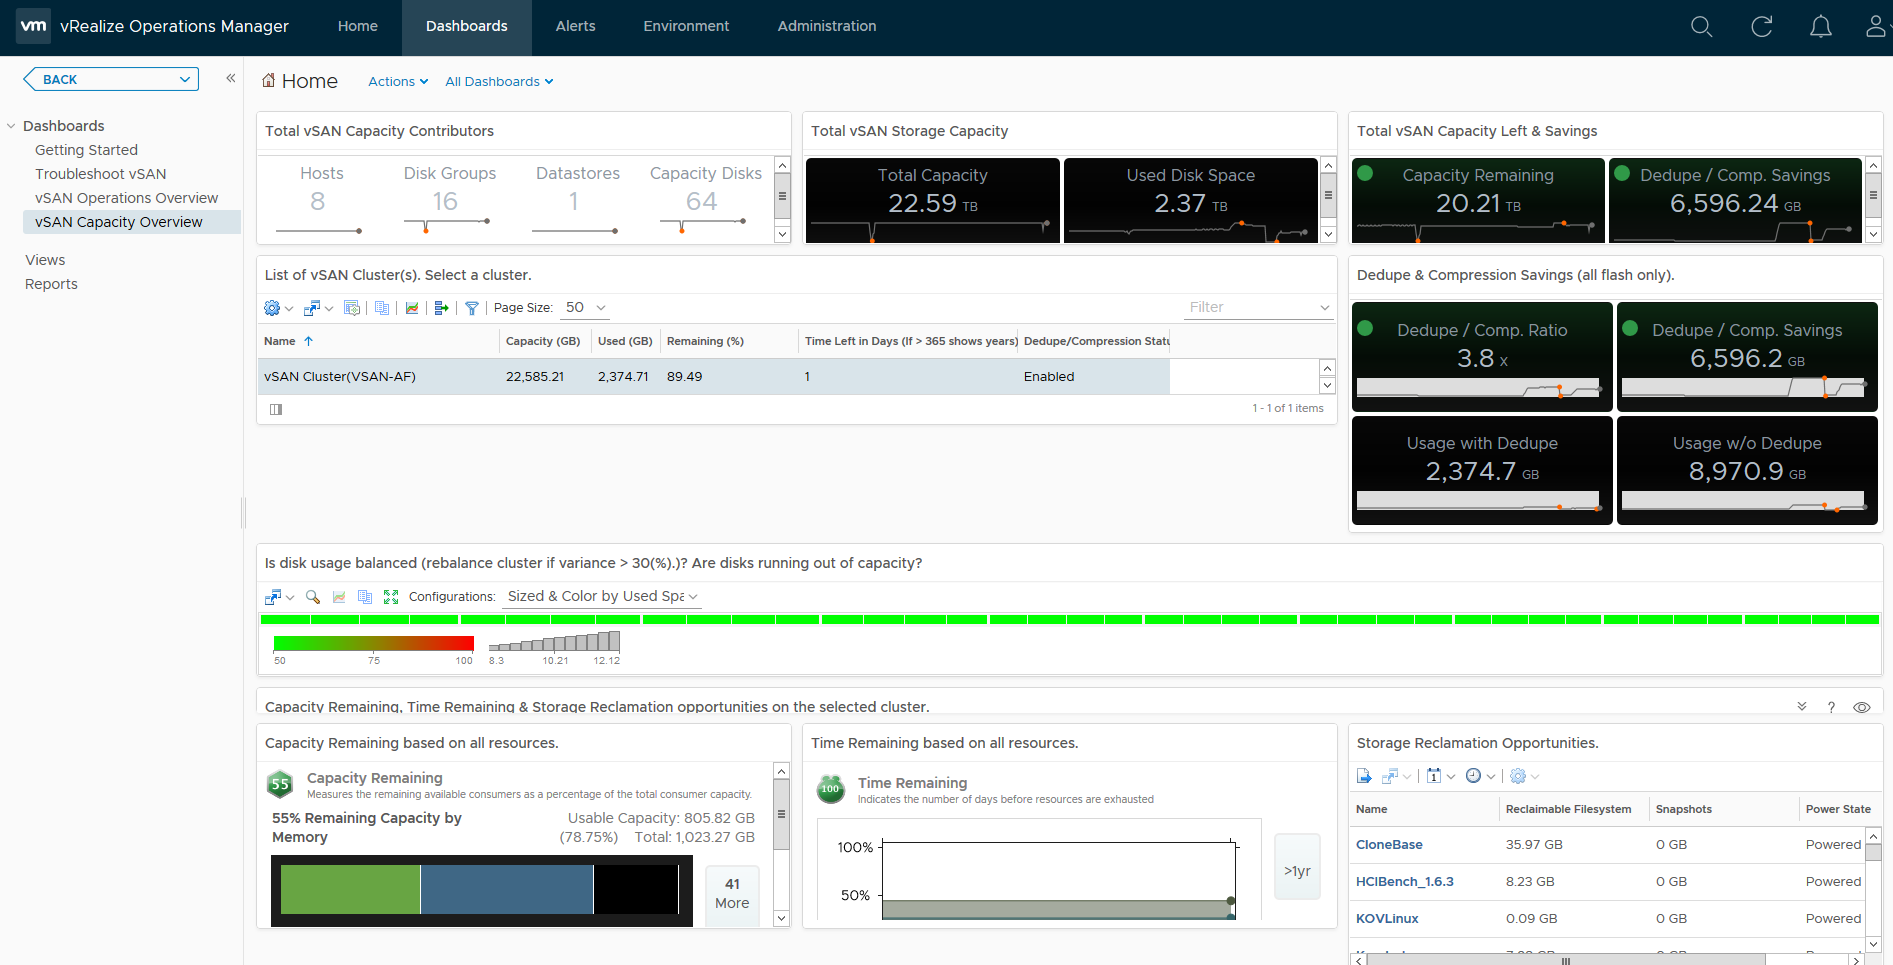
As you can see, the default Capacity Overview Dashboard for vSAN within vROPS has a wealth of information, we can immediately see the dedupe/compression ratio, free capacity, heatmaps on the disks within the cluster, a unique feature vROPS has over the standard capacity UI in vSphere is that it shows you historical data, for example if we take the dedupe/Compression ratio, as you can see in the example it is 3.8x, but the graph below the value shows you how it has changed over time:

Hovering over an area of the graph will provide you an extract of the value at that point in time:

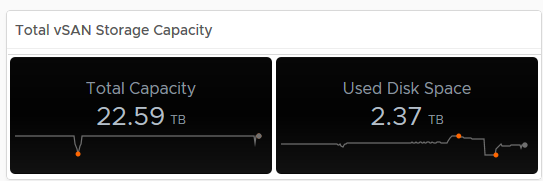
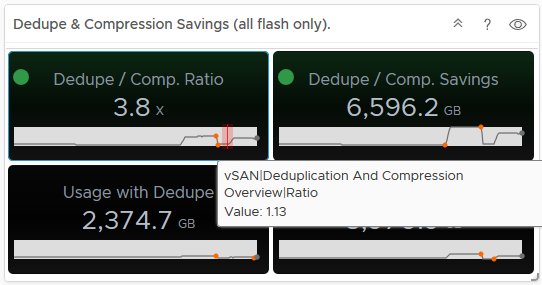
As you can see from the above, my dedupe/Compression dropped to 1.13, now if you tie this into the Used Disk Space screen, you can see that the usage dropped at the same time, indicating a lot of data was deleted (and it actually was on purpose):

In my opinion having this data is pretty important, especially if the cluster is ingesting data and you want to see historically if this is affecting your dedupe/compression ratio for example.

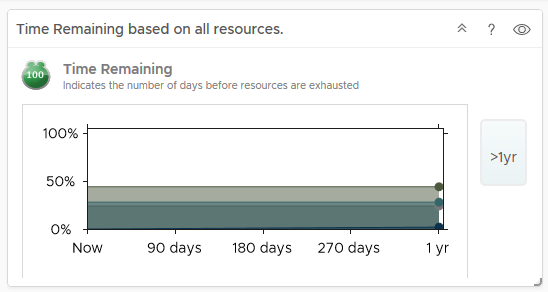
Another unique feature in vRops is the ability to predict when you will run out of resources, now obviously this data is collected over time, so if you deploy out a couple of hundred VMs within a couple of days after deployment, vROPS will tell you that you’re going to run out of space within a few days, but as vROPS gathers statistics after the deployment and learns how quickly VMs grow and your usual deployment/delete cycles, it is pretty accurate at predicting resource exhaustion giving you enough time to plan and cater for adding more resources, my cluster says I have over a year before I run out of resources:

Conclusion:
When it comes to capacity reporting, the native vSAN/vSphere UI provides you with where you are right now and provides you a detailed breakdown as to your vSAN Datastore Consumption, but if you want historical capacity data and trending to predict when you need to add more resources, then vROPS is key, if you arm yourself with both then you have more or less everything you need to provide high levels of detail around your vSAN Capacity.


Day-2 Operations – Health Monitoring

Health monitoring of an infrastructure is a key element of day to day operations, knowing if something is healthy or unhealthy can make the difference between business impact or remediation steps to prevent any impact ot the business.

There are three ways you can monitor the health of vSAN, the native Health Service which is built into the vSphere UI, vRealize Operations (vROPS), and the API all of which have advantages and disadvantages over the other, for the first part we are going to cover the Health UI which is incorporated into the vSphere UI.

vSAN Health Service
In the current release of vSAN (6.6.1) there are two aspects to the Health Service, an Offline version and an Online version, the Offline version is embedded into the vCenter UI Code and any new features are added to this when patches/releases/updates for vSphere are released.  The Online portion of the Health UI is more dynamic, newer health variables are added as part of the Customer Experience and Improvement Program (CEIP), there is a major advantage to using the Online version in the fact that critical patch releases for vSAN can be alerted through the Health UI which is a really cool feature, it also dynamically adds new alarms to vCenter as part of the health reporting, as VMware understands and gets feedback on how customers are using vSAN, VMware can create alarms dynamically to alert/avoid situations that are a cause for concern.

In order to use the Online portion of the health service you need to opt in to the CEIP program, which is as simple as ensuring your vCenter server has internet capability and you have provided a myvmware account credentials.  A lot of customers are concerned with having their vCenter server having the ability to connect out to the internet, as a workaround I recommend a method where vCenter only has an allowed rule to connect to vmware.com addresses such as a proxy server or white list.

The health service is designed to report on all aspects of vSAN health, and trigger alarms in vCenter to alert you to anything that you should pay attention to, in the previous screenshot, you will notice that I have a warning against the cluster, this is due to the cluster disks not being evenly balanced due to me placing two hosts into maintenance mode to perform firmware updates, as you can see from the screenshot on the right, this has also triggered an alarm in vCenter.

A really cool feature of the Health Service is the “Ask VMware” button, simply highlight an issue and click the button and it will load up a VMware Knowledgebase article telling you what the issue means, why it has occurred and steps to remediate, as many of you know, I come from a support background and spent a good few years in VMware Support so the whole ability to self help and be provided with the right information straight away at the click of a button can be a huge time saver in my opinion.   There is a KB article for every section of the Health Service and as you can see from the screenshot on the left for my disk balance warning,  there is quite a lot of detail in each KB article and the resolution steps are well documented and easy to follow. If after you have followed the steps in the KB and your issue still persists, remember to include in your support request that you have followed the KB Article so you are not asked to run through it again as part of troubleshooting.

When you have deployments such as a 2-Node ROBO or a Stretched Cluster, you do not have to tell the Health Service about this, it will automatically detect and populate the appropriate health checks such as Site to Site latency and witness connectivity.

Critical Patch Updates – The Online Health Service also has the ability to make you aware of a critical patch release, as part of the “Build Recommendations” element of the Health Service, so as a critical patch is released, the online health service will dynamically slip entries into the UI to alert you of the release, in my opinion this is so much better than waiting for an email notification.  The benefit for this is that it can be tailored for your environment, so you are not receiving notifications for updates that are not applicable to your environment.

A question I get quite often is how frequent does the Health Service report, the simple answer is by default it is designed to check the health every 60 minutes, in my environment I have this set to the lowest value which is 15 minutes, however, if there is a critical issue for example, a host failure, network connectivity issue or disk failure then the health service will update with this information pretty instantly, it will not wait for the next refresh cycle and again you will see vCenter alarms triggered for the events.

vRealize Operations
Now I have to admit, I am not a vROPS specialist in any way, shape or form, but I have deployed vROPS in my demo environment and have got the vSAN dashboards operational pretty easily without any challenges.  Now to be clear I am using vROPS 6.6.1 which has the built in native vSAN dashboards which were not present in earlier versions and required you to use the vSAN Storage Management pack to enable the capturing of vSAN Metrics, below is a screenshot showing the default metrics reported in then vSAN Operations Overview dashboard

One immediate advantage that vROPS has over the vSphere UI is that vROPS can display a holistic view of all your vSAN clusters, whereas the vSphere UI is only showing you the status for the cluster that is in focus, so if I had multiple vSAN clusters deployed they would all be listed here in this single dashboard which makes operational life that little bit easier.

You can see there’s a wealth of information at your fingertips from an operational perspective, you can immediately see how your cluster(s) are performing as well as any potential issues that have triggered alarms, which then leads us to the Troubleshooting Dashboard, and here you can immediately see the reason for my 8 “Red” alerts:

As you can see, just like the Operations Overview dashboard, the Troubleshooting dashboard has a lot of information, this dashboard is designed to allow you to drill down into specific areas and components within vSAN, provide you heatmaps on various areas such as disks for example which when a heatmap is red it will draw your attention, for example if I was to double click on one of the green squares in section 9 which is labelled “Is the write buffer full on diskgroups” it will take me to that specific cache disk:

Which takes me to a dashboard specific to that disk group and provides me the following metrics:

As you can see from the above screenshot I can see various important information about my disk group, and if the heatmap was red for this specific disk group I would be able to easily see why based on the metrics presented to me, in my case my disk group is healthy.

There is another dashboard in vROPS called Capacity Overview which I will cover on another Day-2 Operations post based around capacity reporting, so watch out for that one.

So as you can see there are immediately advantages and disadvantages of using the Health Service over vROPS and vice versa, in my opinion I think both tools are important in day to day operations and being able to use both tools provides you with the toolset to effectively manage your environments easier.


Cache Sizing

Since vSAN was released in 2014 there has been a bit of confusion as to how much cache should be sized for the cluster, this article is intended to clear that up and provide direction for both Hybrid and All-Flash configurations.? The reason there are differences in the recommendations is primarily because in Hybrid the cache is a Read Cache as well as a Write Buffer and in All-Flash it’s just serving as a Write Buffer, so the sizing is not a “one size fits all”.

Capacity Definitions:

  • RAW Capacity – This is the amount of capacity the vSAN Datastore will provide
  • Usable Capacity – This is the amount of capacity that can be provided based on the FTT level specified in storage policies
  • Provisioned / Deployed Capacity – This is the amount of space taken by objects before FTT is taken into account
  • Consumed Capacity – This is the amount of space that has been consumed by objects taking into account FTT, for example a 100GB Object with FTT=1 will consume 200GB of storage space


Hybrid Cache Sizing
In Hybrid the recommendation has always been 10% of Usable Capacity or Deployed capacity, if we have a 3-Node vSAN cluster, each host has two disk groups and each disk group has 7×1.2TB 10K SAS Drives, that means each host has 16.8TB of RAW Capacity and our 3-Node cluster has 50.4TB of RAW Capacity, based on the following FTT Values in our storage policy this means our total Usable Capacity is:

FTT=0 – 50.4TB
FTT=1 – 25.2TB
FTT=2 – 16.8TB
FTT=3 – 12.6TB

Based on the 10% rule our cache requirements are as follows:

FTT=0 – 5.4TB which equates to 1.8TB Per node which equates to 900GB Per Disk Group
FTT=1 – 2.52TB which equates to 0.84TB Per node which equates to 420GB Per Disk Group
FTT=2 – 1.68TB which equates to 0.56TB Per node which equates to 280GB Per Disk Group
FTT=3 – 1.26TB which equates to 0.42TB Per node which equates to 210GB Per Disk Group

The above sizing is all well and good if you are only using a single FTT method, however vSAN allows you to define policies with different FTT levels which means you can have objects on vSAN that have varying levels of protection, this makes sizing using the above method all the more difficult.

The best way to size the cache in a Hybrid cluster is to base it on your deployed or provisioned capacity, for example in the above RAW capacity of 50.4TB you may choose to have the following as an example

10 Objects based on FTT=0 of 500GB which totals 5TB of Provisioned Capacity and 5TB of Consumed Capacity
10 Objects based on FTT=1 of 500GB which totals 5TB of Provisioned Capacity and 10TB of Consumed Capacty
10 Objects based on FTT=2 of 500GB which totals 5TB of Provisioned Capacity and 15TB of Consumed Capacity
10 Objects based on FTT=3 of 500GB which totals 5TB of Provisioned Capacity and 20TB of Consumed Capacity

If you total up the above, our Provisioned Capacity is 20TB but our Consumed Capacity is 50TB, based on the Provisioned Capacity of 20TB, 10% of this is 2TB which equates to 0.67TB Per Node, or 333GB per Disk Group, this is how your cache in Hybrid should be sized.

All-Flash Cache Sizing
All flash has a lot more factors to consider, Erasure Coding, Dedupe and Compression and the fact that the cache is purely a Write Buffer so we have to take into account write endurance so the usual 10% sizing does not apply here.? In reality the typical 70% Read / 30% Write workload means that a lot of the requests are coming from the Capacity Tier which in this case is flash based anyway, so this means that the cache layer can be much smaller than it would have been in Hybrid for the same RAW capacity, however there is the write endurance factor to take into account.? We all know there is a write buffer limit in vSAN but that does not mean you should limit the size of the SSD drives based on that, the main reason is to increase the endurance of the drive, vSAN will cycle through all the cells on the drive irrelevant of the Write Buffer Limit.? VMware recently published a new sizing guide for All-Flash which is shown below


There we have it!