Tag Archives: p4800X

Full NVMe or not Full NVMe, that is the question

Image result for nvme logo

As you have seen, my recent posts have been around Intel Optane and the performance gains that can be delivered by implementing the technology into a vSAN environment. I have been asked many times about what benefits a full NVMe solution would bring and what such a solution would look like, but before we go into that, let’s talk about NVMe, what exactly is NVMe?

Non-Volatile Memory Express (NVMe) is not a drive type, but more of an interface and protocol solution that looks like is set to replace the SAS/SATA interface. It encompasses a PCIe controller and the whole purpose of NVMe is to exploit the parallelism that flash media provides which in turn reduces the I/O overhead and thus improve performance. As SSDs become faster, protocols like SAS/SATA which were designed for slower hard disks where the delay between the CPU request and data transfer was much higher, the requirement for faster protocols become evident, and this is where NVMe comes into play.

So in a vSAN environment, what does a full NVMe solution look like? Because vSAN is currently a two tier architecture (Cache and Capacity) a full NVMe solution would mean that both tiers have to have NVMe capable drives and this can be done with either all Standard NVMe drives in both cache and capacity, or using a technology like Intel Optane NVMe as the Cache and Standard NVMe as capacity. So from an architecture perspective it is pretty straight forward, but how does performance compare, for this I persuaded my contacts at Intel to provide me some Full NVMe kit in order to perform some benchmark tests, and in order to provide a like for like comparison, I ran the same benchmark tests on an Optane+SATA configuration.

Cluster Specification:
Number of Nodes: 4
Network: 2x 10gbit in LACP configuration
Disk groups per node: 2
Cache Tier both clusters: 2x Intel Optane 375GB P4800X PCIe Add In Card
Capacity Tier Optane/SATA: 8x 3.84TB SATA S4510 2.5″
Capacity Tier Full NVMe: 8x 2.0TB NVMe P4510 2.5″ U.2

Test Plan:
Block Size: 4K, 8K, 16K, 32K, 64K, 128K
I/O Pattern: Random
Read/Write Ratio: 0/100, 30/70, 70/30, 100/0
Number of VMs: 120
Number of VMDKs per VM: 1
Size of VMDK: 50GB
Storage Policy: FTT=1, RAID1

Let’s look at the results:

And if you want the numbers:

So what is clear here that Optane serves really well in the cache tier in both solutions, however in the Full NVMe solution read performance is significantly improved also, in the 128K, 100% read test the 2x10G Links were being pushed to their limits, but not only was we able to push up throughput and IOPS but we also drove down latency, in some cases reducing it by over 50%.

So why would you choose a full NVMe solution? The simple answer here is if you have applications that are latency sensitive then having clusters dedicated to those applications would be adequately provided for from an IOPS, Throughput and Latency perspective with Full NVMe.

Vendors have also recognised this, for example Dell EMC have just launched their Intel Optane Powered Full NVMe vSAN Ready node, based on the R740xd platform and consists of similar drives to what I have used in the tests here being the Optane 375GB and P4510 U.2 NVMe drives, you can see the vSAN ready node details here

So clearly NVMe has major performance benefits over traditional SAS/SATA devices, could this be the end of SAS/SATA in the not so distant future?

Linear scaling is anything but a myth

I have many conversations with many people, whether they be customers, friends, colleagues, potential customers but the question is always the same, does vSAN really scale linearly?

So to answer this question, I have access to an 8-Node cluster which I essentially removed four of the nodes and ran a performance test usinc HCI Bench, for the 4-Node cluster I ran a total of 120 VMs and for scalability reasons 240 VMs in the 8-Node cluster.

For the purpose of the test, I wanted to run all the performance tests I have ran previously so all block sizes up to 128K as well as Read/Write percentages of 0%, 30%, 70% and 100%, so let us take a look at the 4-Node performance:

IOPS of the 4 Node Cluster
Throughput in MB/sec
Latency in ms

As you can see even the four node cluster was pretty performant and we can see that the four node cluster can quite easily achieve in excess of 200K IOPS on reads, and 150K IOPS on 70/30 split, so what happens when we add another 4 nodes to the cluster?

IOPS
Throughput MB/sec
Latency

So as you can see from both the tests, latency was pretty much similar in both sets of tests indicating it was a pretty comparable test, so the IOPS and Throughput was more or less double when doubling the size of the cluster proving that vSAN does scale linearly. I would have liked to have had an additional 8-nodes to show further scaling, but in all the customers who I have spoken to about increasing their cluster sizes, they confirm that it scales linearly.

Oracle performance on HPE Synergy, vSAN and Intel Optane

Image result for hpe synergy

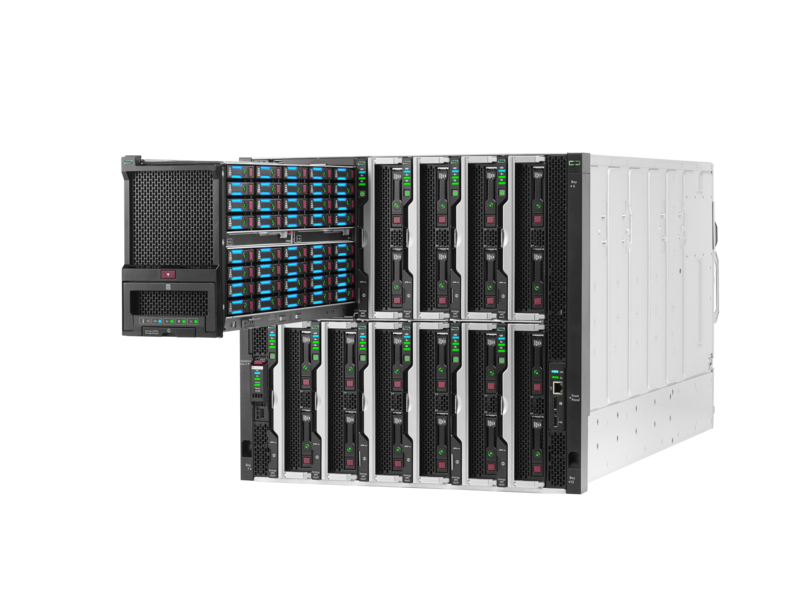
I had the privilege recently to work with a customer who had asked HPE to perform some performance benchmarks not just with HCI Bench, but because they run quite a lot of Oracle workloads they wanted to determine if the performance of vSAN on HPe Synergy would be sufficient in order to run their workloads.

Whilst agreeing on the hardware specification, the customer had referenced my previous post on Optane™ Performance and had asked HPE to perform the tests using Optane™ as the cache tier in the Synergy configuration, this was not only to provide a superior performance experience, but it also would free up two capacity slots in the disk tray of the chassis per Synergy compute node meaning the customer could have more capacity.

Synergy Specification:

  • HPE Virtual Connect SE 40Gb F8 Module for Synergy
  • HPE Synergy D3940 Storage Module with SAS expanders
  • 3x HPE Synergy 480 Gen10 nodes, each equipped with:
  • 2x Intel® Xeon® Gold 6154 CPU @ 3.00GHz
  • 2x Intel® Optane™ 750 GB SSD DC P4800X Series PCIe (x4)
  • 768 GB Memory (24x 32 GB RDIMM @ 2666 MHz)
  • 2x Disk Group config with 1x Optane + 3x 800GB SAS per Disk Group
  • LACP based 40GbE interconnection between Compute Nodes

Please note: At the time of writing the 750GB U.2 Optane drives were undergoing certification for HPE Synergy.

In order to perform the Oracle workload testing HPE engaged with their own internal Oracle specialists to determine the correct workloads that needed to be performed, and with a target of <2ms specified by the customer they decided to use Kevin Closson’s SLOB tool, SLOB was configured in the following way:

  • 128 SLOB Schemas
  • Each Schema was 8GB in Size
  • Total of 1TB Test data

For the purpose of testing HPE decided that they would perform different tests in the following way:

  • (A) Single Oracle VM Instance with 128 Schemas, 70% Read, 30% Write
  • (B) Single Oracle VM Instance with 128 Schemas, 50% Read, 50% Write
  • (C&D) Single Oracle VM Instance with Heavy REDO activity and Large SGA and REDO_STRESS=Heavy, 50% Read, 50% Write, with 128 Schemas and 32 Schemas
  • (E) Single Oracle VM Instance
  • (F & G) 2 Parallel Oracle VM Instances with 64 / 128 Schemas Each, 70% Read, 30% Write
TestSGAPGASchemasScaleREDO_STRESS
A5G1G1288GLite
B5G1G1288GLite
C256G100G1288GHeavy
D256G100G328GHeavy
E5G1G1288GLite
F5G1G648GLite
G5G1G1288GLite

Before the tests were performed, and Oracle I/O Calibration was performed which is a feature of Oracle Databases and is used to assess the performance of the I/O subsystem by issuing an I/O intensive read-only workload in order to determine the maximum IOPS and throughput whilst maintaining close to 0ms latency.

Each test ran for 60 minutes in order to ensure enough data was filling up the write buffer, so let’s take a look at the results:

As you can see from the results, the target of <2ms was achieved successfully and at one point with two oracle VMs achieveing a staggering 250k IOPS at 1.305ms latency is very impressive across a 3-Node cluster, not only was the customer pleased with the results, but the Oracle Specialist within HPE said that the results exceeded their expectations also.

So as you can see, a composable infrastructure deployment of vSAN such as HPE Synergy with Intel Optane™ can still deliver the same levels of performance as standard rack mount servers, combined with VMware Cloud Foundation delivering a full SDDC package from both a hardware and software perspective.