Tag Archives: provisioned

Day-2 Operations – vSphere built in vROPS dashboards

At VMworld I ran a few sessions on Day-2 Operations which I also covered the new built in dashboards for vROPS which were introduced with the fully baked HTML5 client in vSAN/vSphere 6.7.  Many people were not aware of the dashboards and moreso were not aware that these vSAN specific dashboards continue to work even after the 90 day trial period has expired.  Not only that but VMware has done a great job in automating a deployment of vROPS if you have not already got an appliance deployed.  So let’s take a look at these new dashboards in a bit more detail.

Firstly the three vSphere operations Dashboards, the default one that loads up is an overview dashboard of all your clusters:

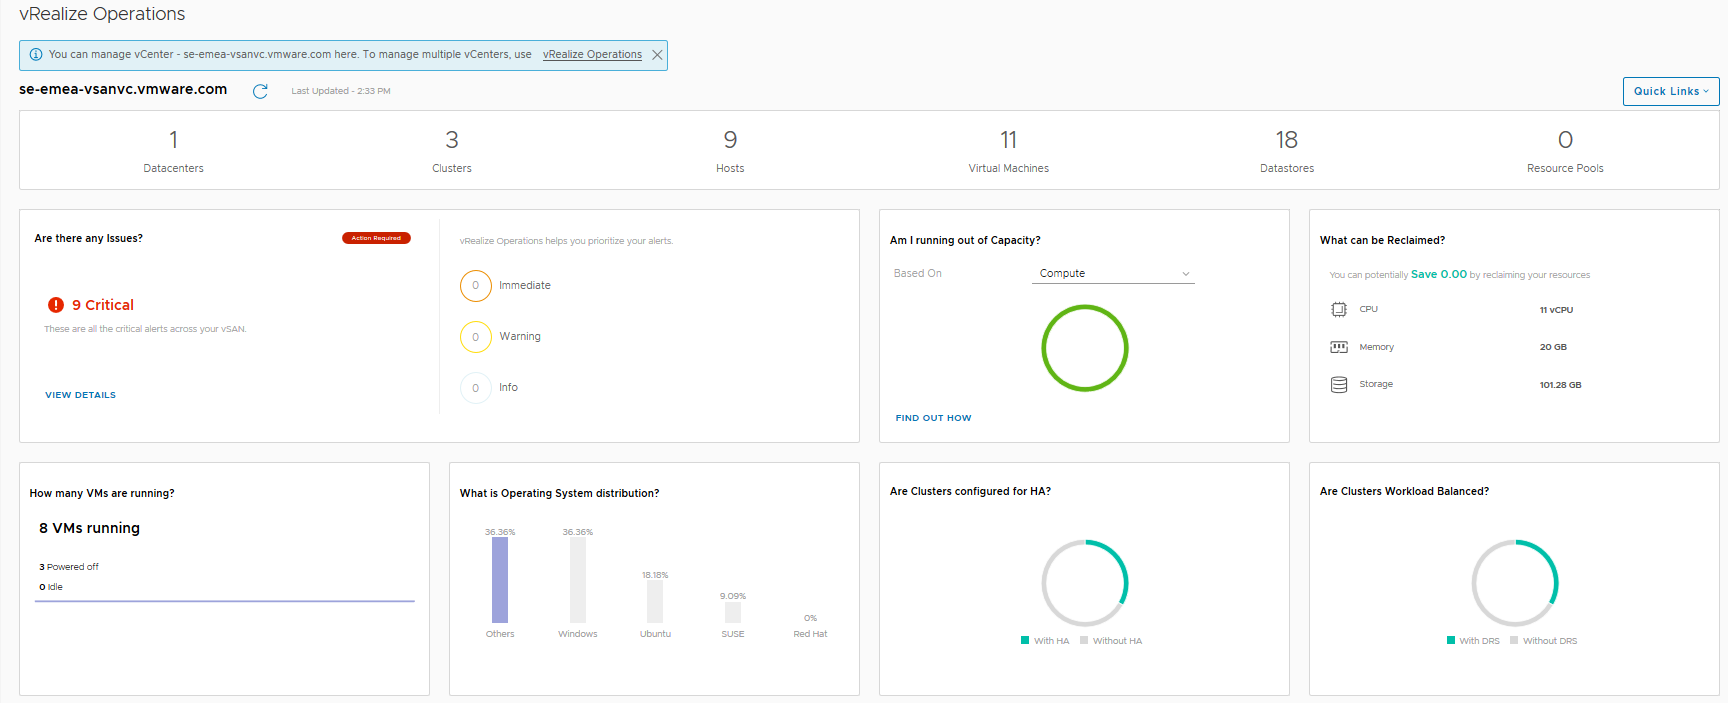
Then there is the Cluster Level View where you pick a specific cluster:

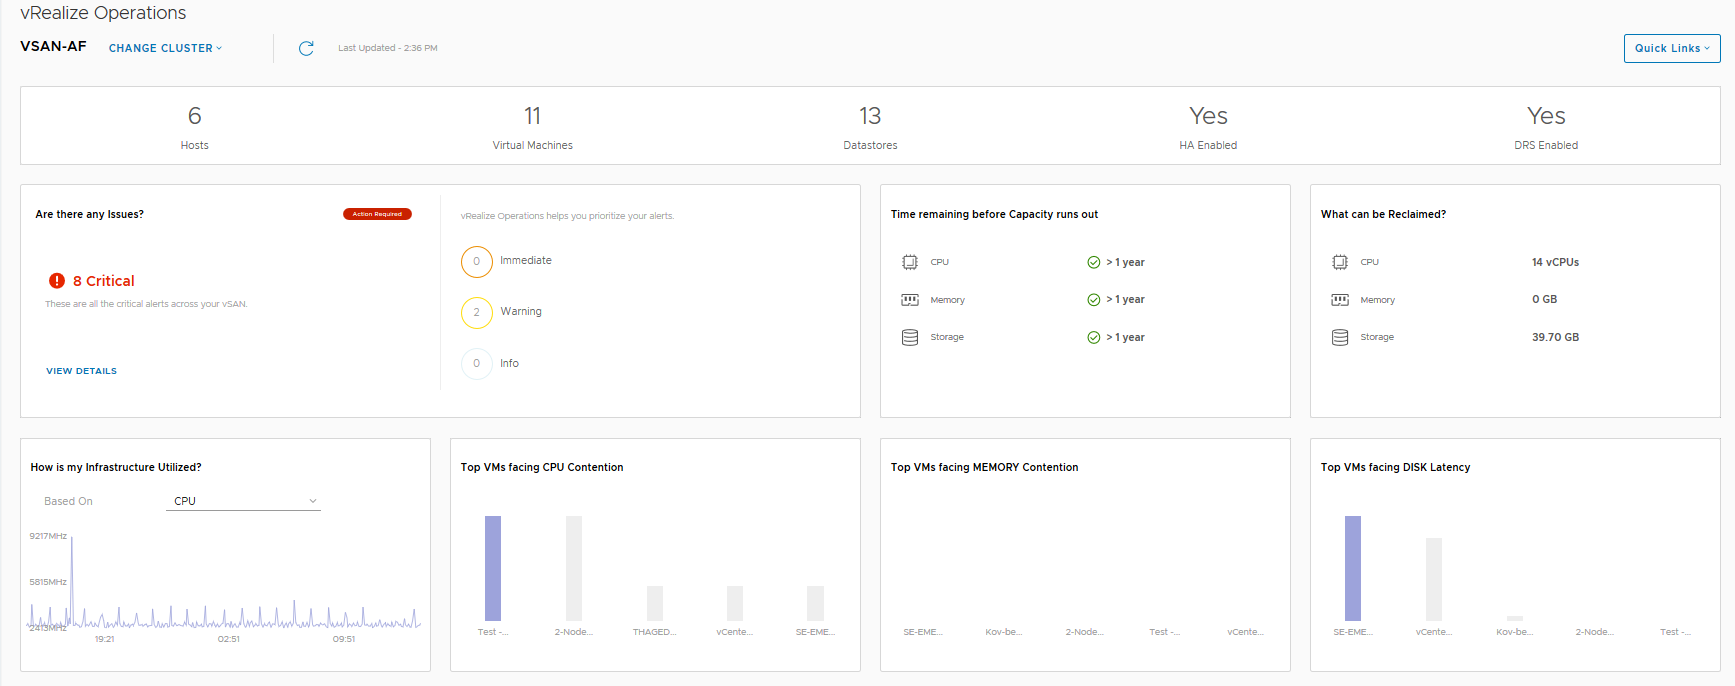
And finally is the Alerts view…Great timing, I have a physical disk failure in the vSAN Cluster:
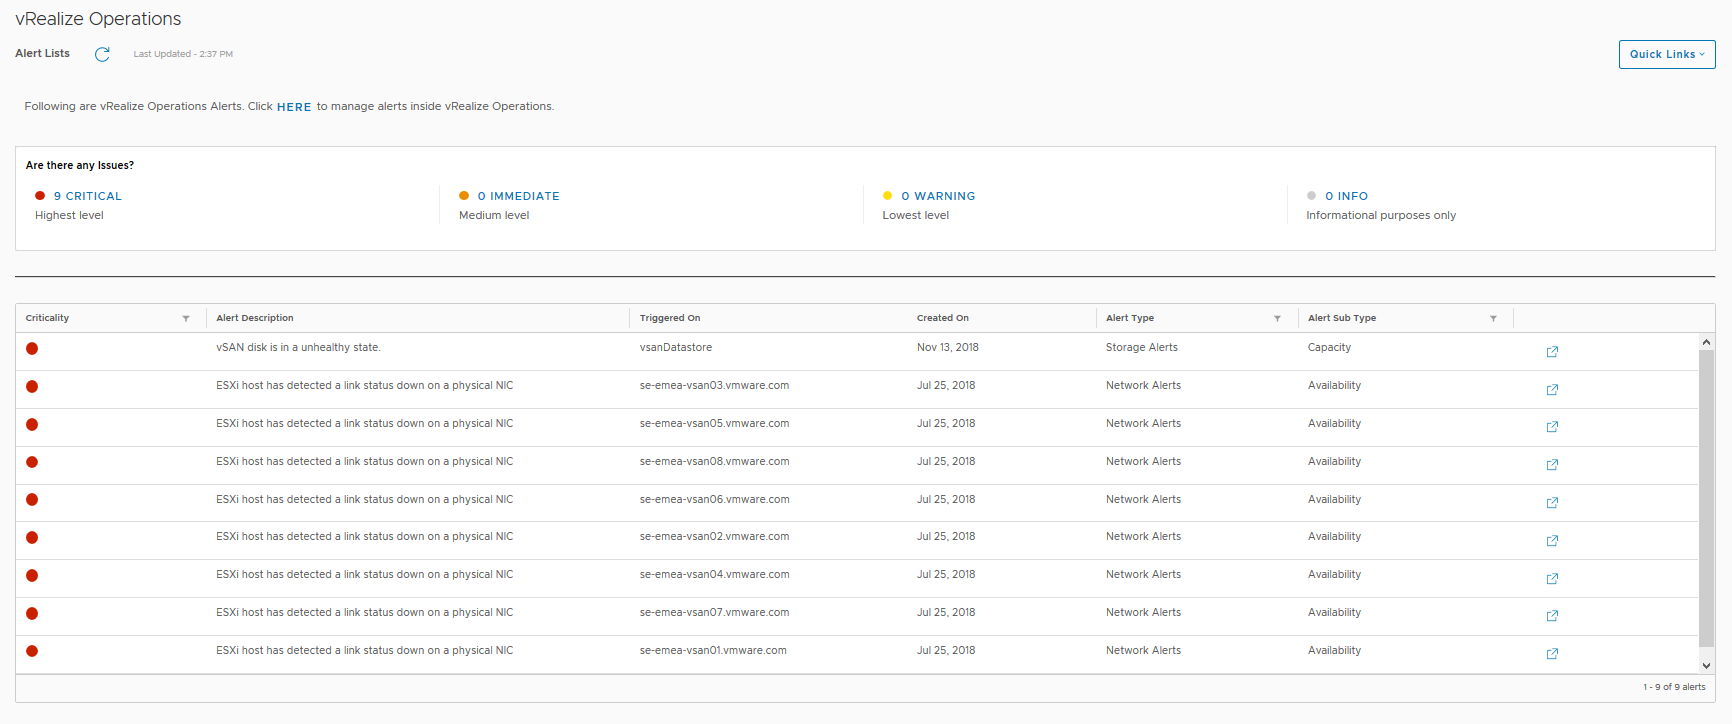
Now the above three dashboards will no longer be available after the 90 day trial period has expired, and also the link to the vRealize Operations appliance will not be functional either, but after the 90 day trial period has expired, the following three vSAN Dashboards will still be fully functional and available, so let’s look at those in a bit more detail:

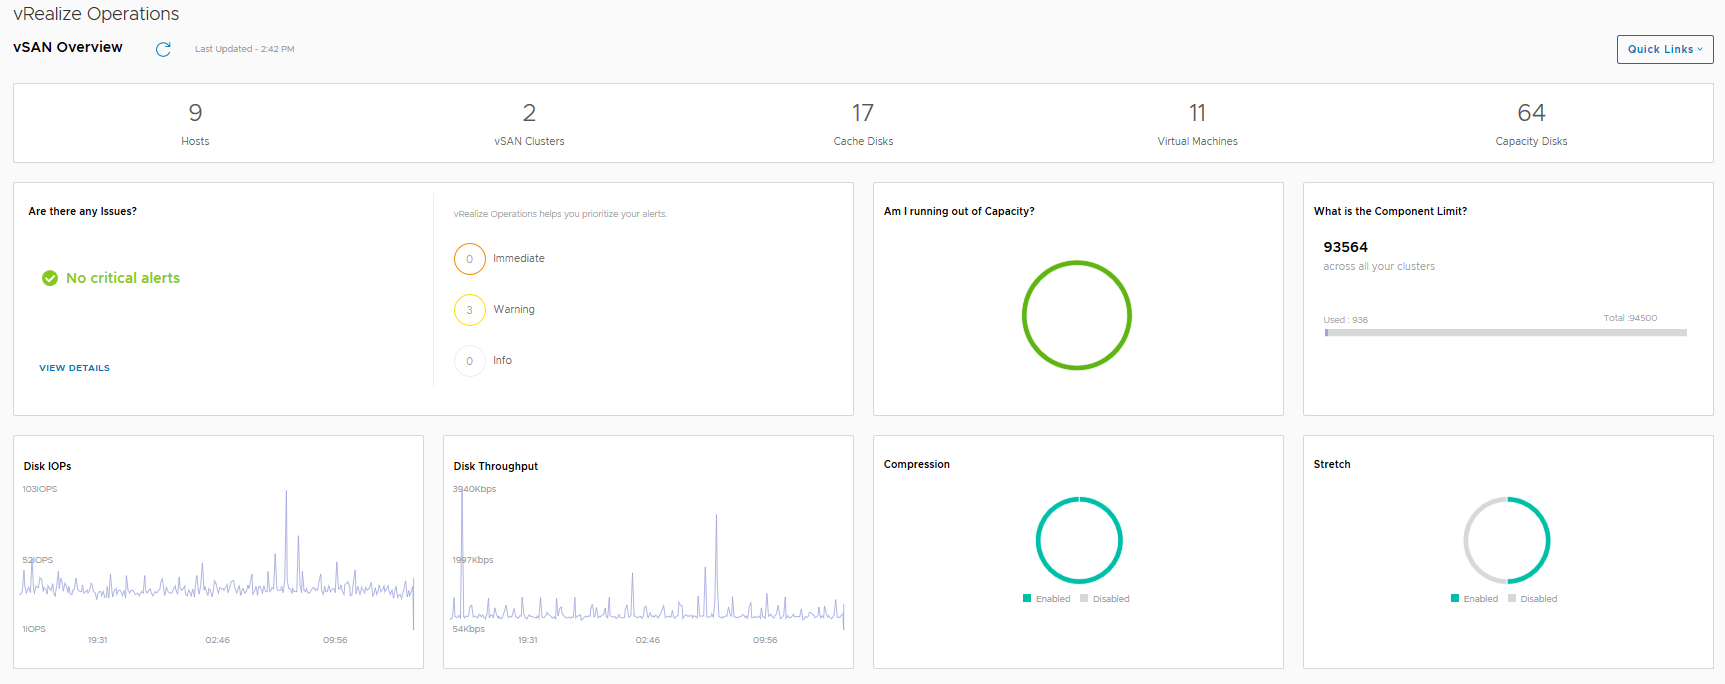
The vSAN Overview dashboard, like the vSphere overview dashboard, displays information at a holistic level for all of your vSAN Clusters within this particular vCenter server, you will see that the dashboard provides information on how many clusters are running dedupe/compression, or how many of the clusters are a Stretched Cluster for example.  The dashboard also shows if you need to investigate any current alerts (yes I cleaned up the failed disk before grabbing this screenshot).

The next dashboard we choose a specific cluster to look at in more detail:
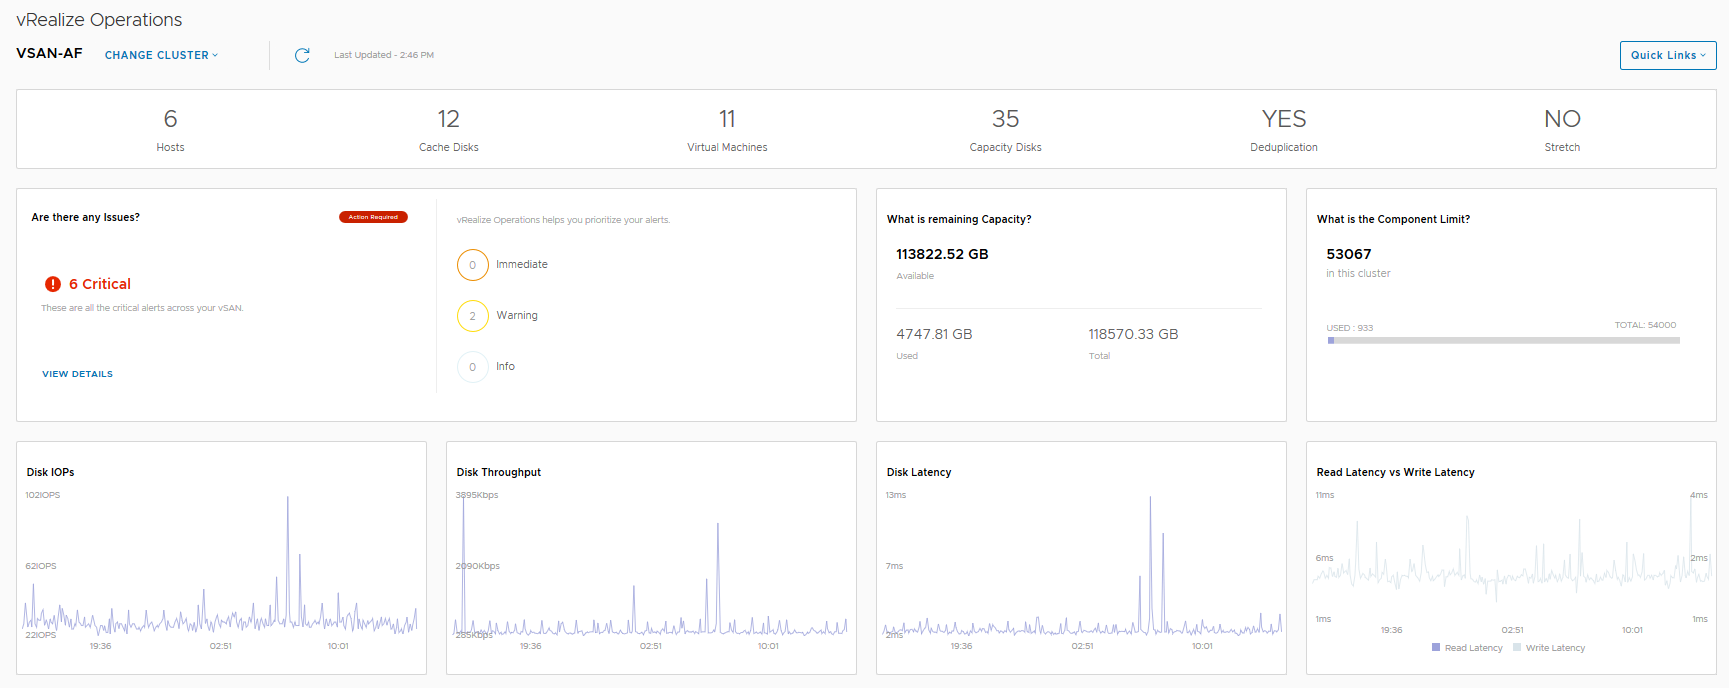
In this dashboard we see information pertaining to a specific cluster, we can see that I have 6 critical alerts which we will take a look at next, but there are some key metrics here that from an operational perspective are pretty important from a day-2 operations standpoint:

  • Remaining Capacity
  • Component Limit
  • IOPS, Throughput and Latency statistics
  • Read versus Write latency

The last dashboard is alerts:
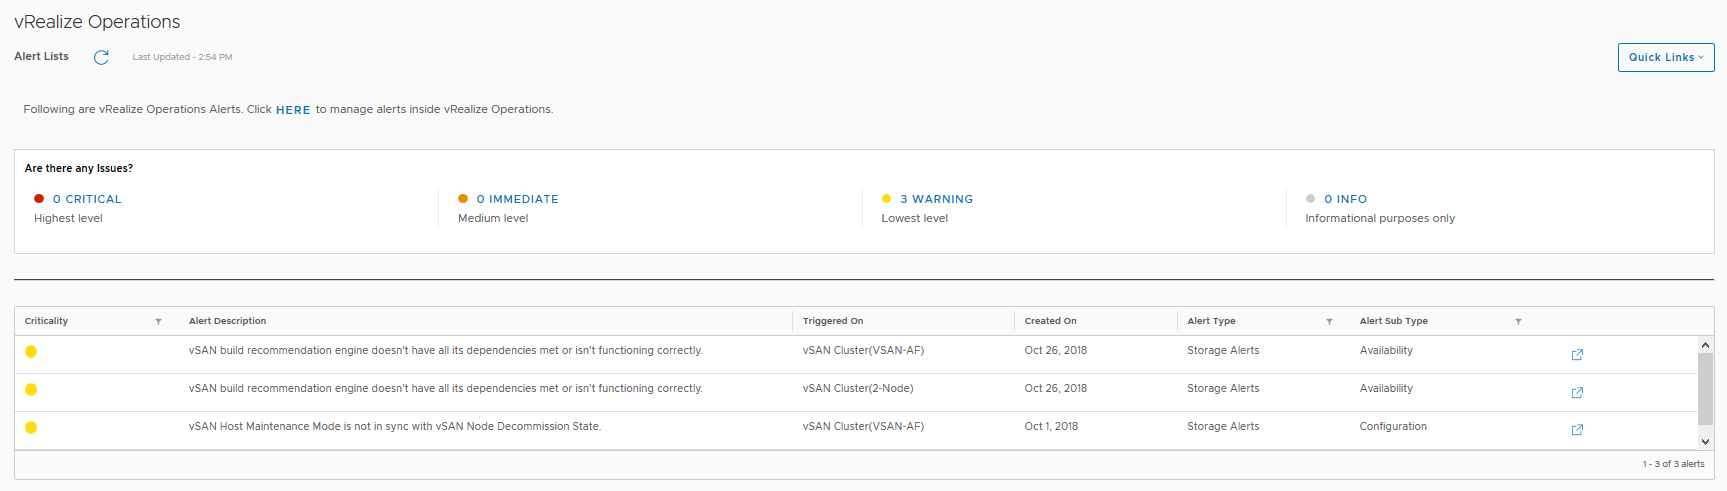
Here we can see the current alerts that have been triggered for each cluster which may need to be addressed, the critical alerts previously highlighted in the cluster view were all related to a network redundancy lost when I was troubleshooting packet loss on the physical switch.

So as you can see there’s a really good amount of detail in the vSphere UI relating to vROPS making the day-2 operations a lot easier to perform.


Day-2 Operations – Capacity Reporting

One of the challenges in storage history is being able to see what exactly is consuming the capacity on a particular datastore, even in my VMware Support days asking the question to a customer would result in a response of “I don’t know exactly”.  This all changed with vSAN, it was recognize that providing a bit more granularity about what exactly is consuming the space on my datastore can offer some really good insights and explanations to the question “Where has my space gone?”

Built into the standard UI for vSphere/vSAN, located under the Monitor/vSAN section is a screen called “Capacity”, and just like the title, it does exactly that, it reports on your capacity as well as giving a breakdown as to what is using the capacity, before we talk about that a bit further, let’s start with the basic fundamental requirements of capacity reporting and that is:

  1. What capacity do I have in total?
  2. What capacity have I used?
  3. What capacity have I got free?
  4. What space savings have I got with dedupe/Compression?

One thing I want to call out which is a question I get asked pretty much most of the time and it is the “Deduplication and Compression overhead” value, as you can see from the above screenshot, in my cluster this is 1.23TB of space, now if you do the math you can work out that this is around 5% of my datastore capacity.  This value will not change as my dedupe/compression ratio increases or decreases.  The only time this value will increase is if I add more capacity (by adding more disks with new disk groups) as the value is around 5% of the overall datastore capacity.

As you can see from the above screenshot the UI answers the fundamental questions right away without any question, but what if your datastore is pretty full and your boss comes over to you and asks you to give them some detail about what is consuming the space?  Well further down the screen is a bit more detail as to the breakdown of consumption:

As you can clearly see there’s a pretty detailed list of consumers for my vSAN datastore, and as an extra bonus, when you hover over an item, it gives a bit more detail about what exactly counts as part of that item, if you take “Other” for example:

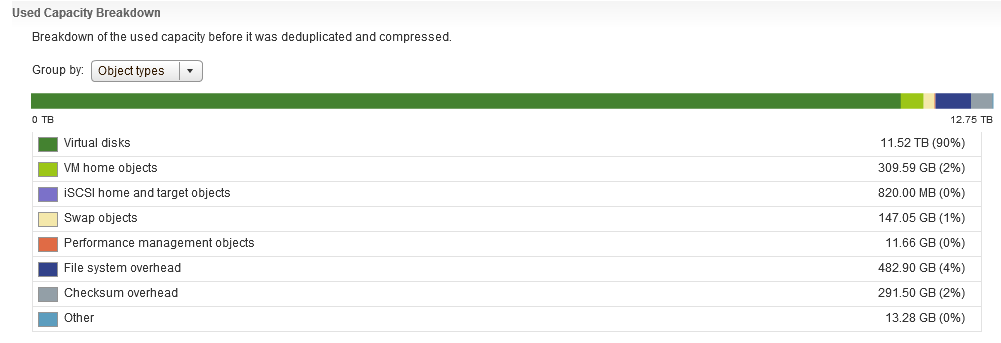
One thing that you will immediately notice here is that there is no category for Snapshots, now I remember in my support days, Snapshots were any administrators nightmare, especially when you have inadvertently ran your Exchange server on snapshots for almost 12 months without knowing, so in my opinion that is some important detail that is missing here and that feedback has been provided.

Capacity Reporting in vRealize Operations
Now vROPS doesn’t go into the level of detail about what exactly is consuming the space on the vSAN Datastore but it offers another insight as to capacity usage.  Unlike the capacity reporting screen within the vSphere UI for vSAN which only provides a point in time view of your capacity, vROPS gives you historical data, lets firstly take a look at what the dashboard looks like:

As you can see, the default Capacity Overview Dashboard for vSAN within vROPS has a wealth of information, we can immediately see the dedupe/compression ratio, free capacity, heatmaps on the disks within the cluster, a unique feature vROPS has over the standard capacity UI in vSphere is that it shows you historical data, for example if we take the dedupe/Compression ratio, as you can see in the example it is 3.8x, but the graph below the value shows you how it has changed over time:

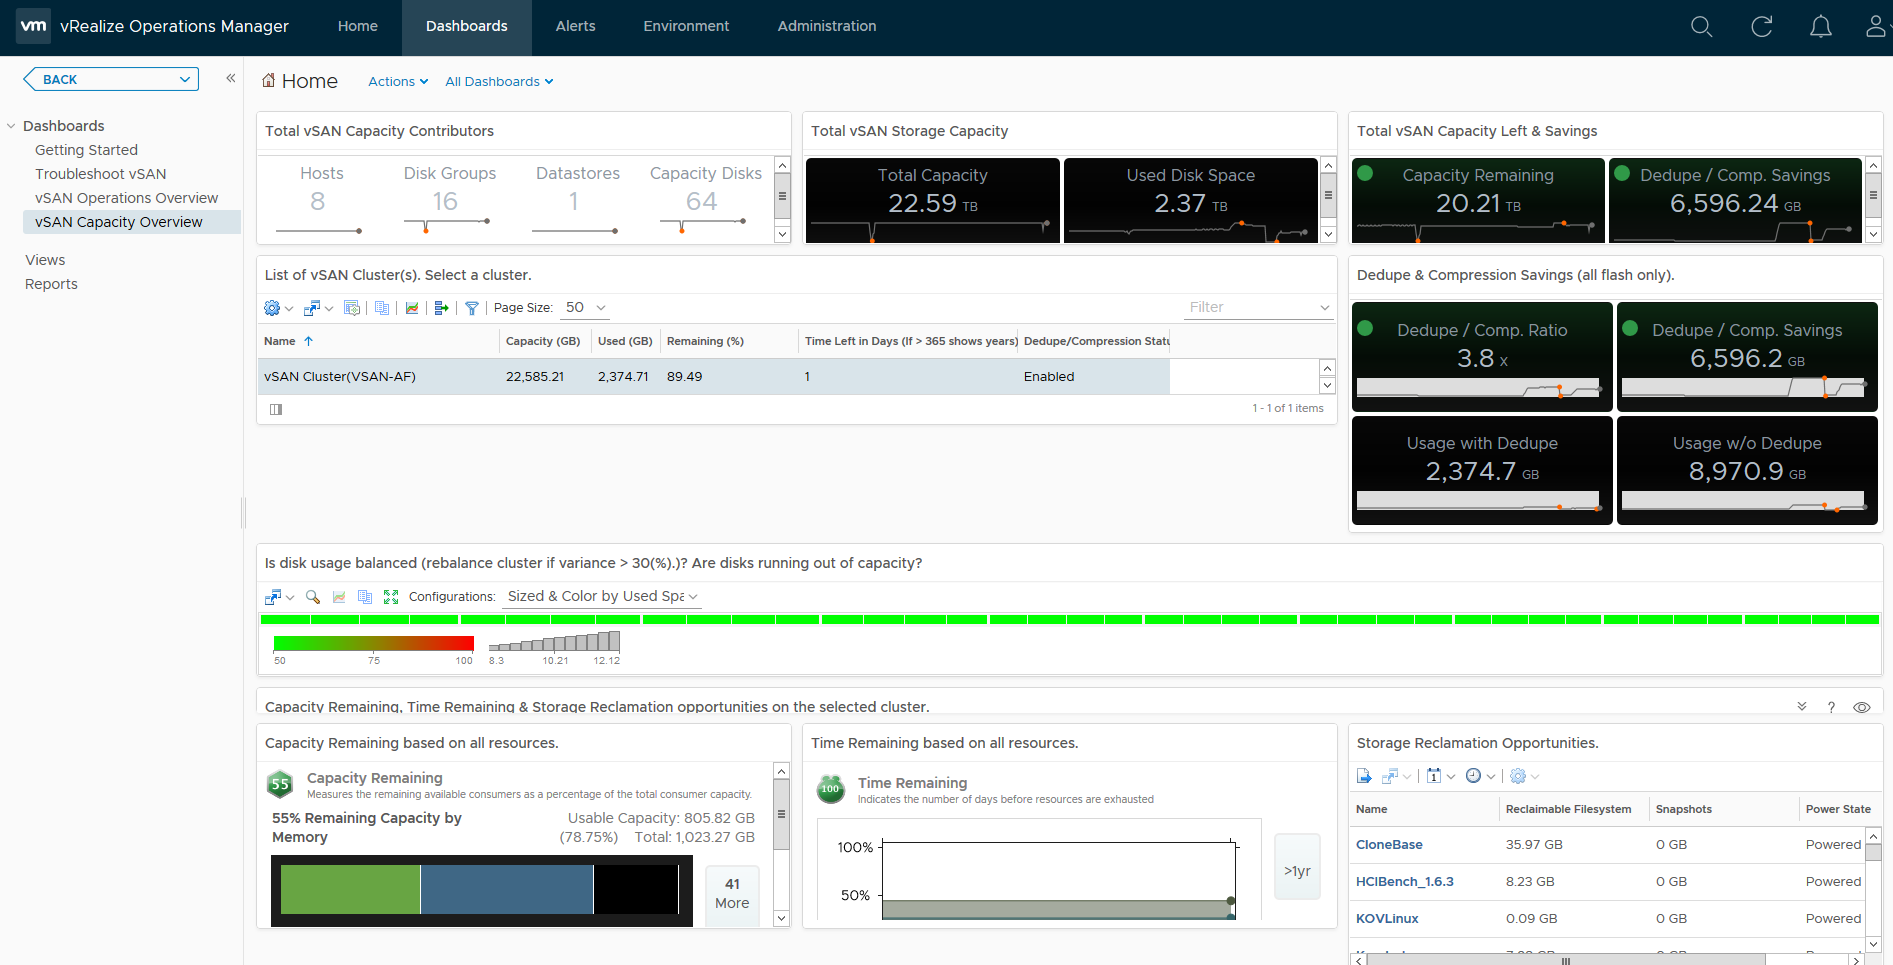
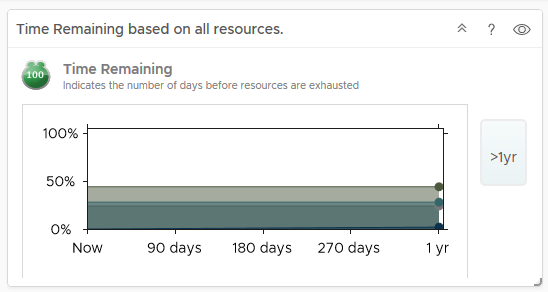
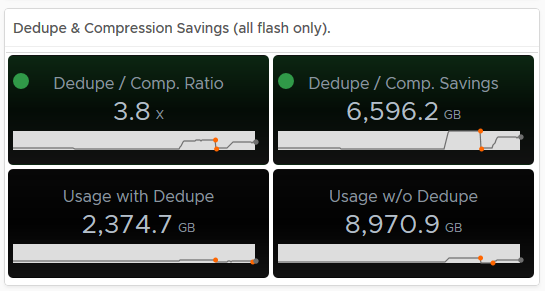
Hovering over an area of the graph will provide you an extract of the value at that point in time:

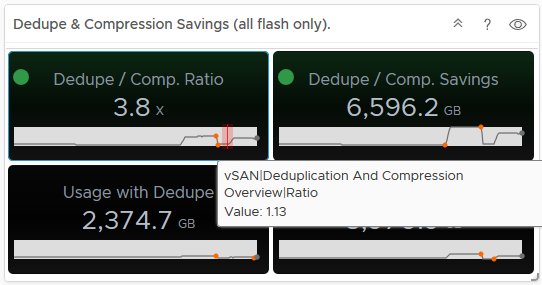
As you can see from the above, my dedupe/Compression dropped to 1.13, now if you tie this into the Used Disk Space screen, you can see that the usage dropped at the same time, indicating a lot of data was deleted (and it actually was on purpose):

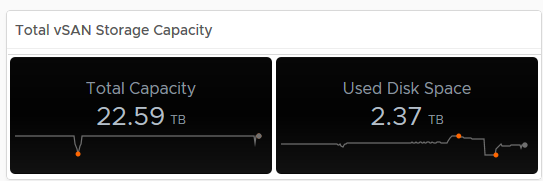
In my opinion having this data is pretty important, especially if the cluster is ingesting data and you want to see historically if this is affecting your dedupe/compression ratio for example.

Another unique feature in vRops is the ability to predict when you will run out of resources, now obviously this data is collected over time, so if you deploy out a couple of hundred VMs within a couple of days after deployment, vROPS will tell you that you’re going to run out of space within a few days, but as vROPS gathers statistics after the deployment and learns how quickly VMs grow and your usual deployment/delete cycles, it is pretty accurate at predicting resource exhaustion giving you enough time to plan and cater for adding more resources, my cluster says I have over a year before I run out of resources:

Conclusion:
When it comes to capacity reporting, the native vSAN/vSphere UI provides you with where you are right now and provides you a detailed breakdown as to your vSAN Datastore Consumption, but if you want historical capacity data and trending to predict when you need to add more resources, then vROPS is key, if you arm yourself with both then you have more or less everything you need to provide high levels of detail around your vSAN Capacity.


Cache Sizing

Since vSAN was released in 2014 there has been a bit of confusion as to how much cache should be sized for the cluster, this article is intended to clear that up and provide direction for both Hybrid and All-Flash configurations.? The reason there are differences in the recommendations is primarily because in Hybrid the cache is a Read Cache as well as a Write Buffer and in All-Flash it’s just serving as a Write Buffer, so the sizing is not a “one size fits all”.

Capacity Definitions:

  • RAW Capacity – This is the amount of capacity the vSAN Datastore will provide
  • Usable Capacity – This is the amount of capacity that can be provided based on the FTT level specified in storage policies
  • Provisioned / Deployed Capacity – This is the amount of space taken by objects before FTT is taken into account
  • Consumed Capacity – This is the amount of space that has been consumed by objects taking into account FTT, for example a 100GB Object with FTT=1 will consume 200GB of storage space


Hybrid Cache Sizing
In Hybrid the recommendation has always been 10% of Usable Capacity or Deployed capacity, if we have a 3-Node vSAN cluster, each host has two disk groups and each disk group has 7×1.2TB 10K SAS Drives, that means each host has 16.8TB of RAW Capacity and our 3-Node cluster has 50.4TB of RAW Capacity, based on the following FTT Values in our storage policy this means our total Usable Capacity is:

FTT=0 – 50.4TB
FTT=1 – 25.2TB
FTT=2 – 16.8TB
FTT=3 – 12.6TB

Based on the 10% rule our cache requirements are as follows:

FTT=0 – 5.4TB which equates to 1.8TB Per node which equates to 900GB Per Disk Group
FTT=1 – 2.52TB which equates to 0.84TB Per node which equates to 420GB Per Disk Group
FTT=2 – 1.68TB which equates to 0.56TB Per node which equates to 280GB Per Disk Group
FTT=3 – 1.26TB which equates to 0.42TB Per node which equates to 210GB Per Disk Group

The above sizing is all well and good if you are only using a single FTT method, however vSAN allows you to define policies with different FTT levels which means you can have objects on vSAN that have varying levels of protection, this makes sizing using the above method all the more difficult.

The best way to size the cache in a Hybrid cluster is to base it on your deployed or provisioned capacity, for example in the above RAW capacity of 50.4TB you may choose to have the following as an example

10 Objects based on FTT=0 of 500GB which totals 5TB of Provisioned Capacity and 5TB of Consumed Capacity
10 Objects based on FTT=1 of 500GB which totals 5TB of Provisioned Capacity and 10TB of Consumed Capacty
10 Objects based on FTT=2 of 500GB which totals 5TB of Provisioned Capacity and 15TB of Consumed Capacity
10 Objects based on FTT=3 of 500GB which totals 5TB of Provisioned Capacity and 20TB of Consumed Capacity

If you total up the above, our Provisioned Capacity is 20TB but our Consumed Capacity is 50TB, based on the Provisioned Capacity of 20TB, 10% of this is 2TB which equates to 0.67TB Per Node, or 333GB per Disk Group, this is how your cache in Hybrid should be sized.

All-Flash Cache Sizing
All flash has a lot more factors to consider, Erasure Coding, Dedupe and Compression and the fact that the cache is purely a Write Buffer so we have to take into account write endurance so the usual 10% sizing does not apply here.? In reality the typical 70% Read / 30% Write workload means that a lot of the requests are coming from the Capacity Tier which in this case is flash based anyway, so this means that the cache layer can be much smaller than it would have been in Hybrid for the same RAW capacity, however there is the write endurance factor to take into account.? We all know there is a write buffer limit in vSAN but that does not mean you should limit the size of the SSD drives based on that, the main reason is to increase the endurance of the drive, vSAN will cycle through all the cells on the drive irrelevant of the Write Buffer Limit.? VMware recently published a new sizing guide for All-Flash which is shown below


There we have it!